Prometheus 运维工具 Promtool的使用

Promtool 是 Prometheus 提供的一个运维工具,用来对 Prometheus 进行检查,之前只有最简单的检查配置文件和规则文件的功能,现在已经有了更多的新功能,包括查询指标、debug 服务、对数据库进行检查等等

Prometheus 运维工具 Promtool (一)Check 功能

Prometheus 运维工具 Promtool (二)Query 功能

Prometheus 运维工具 Promtool (三)Debug 功能

Prometheus 运维工具 Promtool (四)TSDB 功能

https://blog.csdn.net/zgq_hw/article/details/89440727

https://developer.aliyun.com/article/996160?userCode=okjhlpr5

https://zhuanlan.zhihu.com/p/626563817

https://blog.51cto.com/erdong/5777236

https://www.cnblogs.com/zccoming/p/15605033.html

promtool check rules xxx/.yaml

1
2
3
4
5
6
7
8
9
10
11
12
13
14
15
16
17
18
19
20
21
22
23
24
25
26
27
28
29
30
31
32
33
34
35
36
37
38
39
40
41
42
43
44
45
46
47
48
49
50
51
52
53
54
55
56
57
58
59
60
61
62
63
64
65
66
67
68
69
70
71
72
73
74
75
76
77
78
79
80
81
./promtool -h
usage: promtool [<flags>] <command> [<args> ...]

Tooling for the Prometheus monitoring system.

Flags:
-h, --help Show context-sensitive help (also try --help-long and --help-man).
--version Show application version.
--enable-feature= ... Comma separated feature names to enable (only
PromQL related and no-default-scrape-port). See
https://prometheus.io/docs/prometheus/latest/feature_flags/ for the
options and more details.

Commands:
help [<command>...]
Show help.

check service-discovery [<flags>] <config-file> <job>
Perform service discovery for the given job name and report the results, including relabeling.

check config [<flags>] <config-files>...
Check if the config files are valid or not.

check web-config <web-config-files>...
Check if the web config files are valid or not.

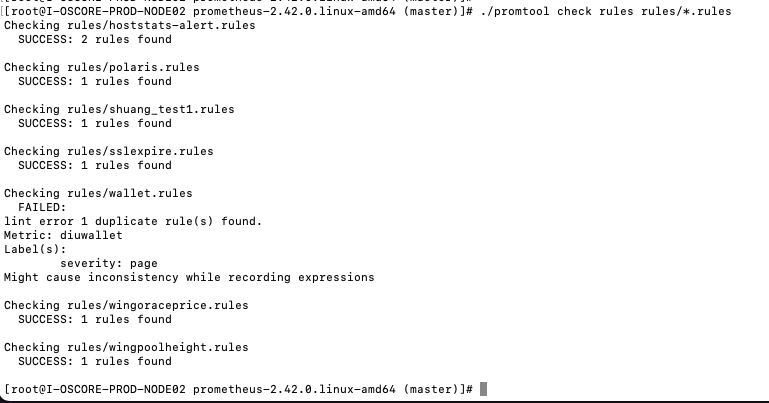
check rules [<flags>] <rule-files>...
Check if the rule files are valid or not.

check metrics
Pass Prometheus metrics over stdin to lint them for consistency and correctness.

examples:

$ cat metrics.prom | promtool check metrics

$ curl -s http://localhost:9090/metrics | promtool check metrics

query instant [<flags>] <server> <expr>
Run instant query.

query range [<flags>] <server> <expr>
Run range query.

query series --match=MATCH [<flags>] <server>
Run series query.

query labels [<flags>] <server> <name>
Run labels query.

debug pprof <server>
Fetch profiling debug information.

debug metrics <server>
Fetch metrics debug information.

debug all <server>
Fetch all debug information.

test rules <test-rule-file>...
Unit tests for rules.

tsdb bench write [<flags>] [<file>]
Run a write performance benchmark.

tsdb analyze [<flags>] [<db path>] [<block id>]
Analyze churn, label pair cardinality and compaction efficiency.

tsdb list [<flags>] [<db path>]
List tsdb blocks.

tsdb dump [<flags>] [<db path>]
Dump samples from a TSDB.

tsdb create-blocks-from openmetrics <input file> [<output directory>]
Import samples from OpenMetrics input and produce TSDB blocks. Please refer to the storage docs
for more details.

tsdb create-blocks-from rules --start=START [<flags>] <rule-files>...
Create blocks of data for new recording rules.

1
2
3
4
5
6
7
8
9
10
11
12
13
14
15
16
17
18
19
20
21
22
23
24
25
26
27
28
29
30
31
32
33
34
35
36
37
38
39
40
41
42
43
44
45
46
47
48
49
50
51
52
53
54
55
56
57
58
59
60
61
62
63
64
65
66
67
68
69
70
71
72
73
74
75
76
77
78
79
80
81
82
83

./promtool -h
用法:promtool [<flags>] <command> [<args> ...] (<标志>)

Prometheus 监控系统的工具。

标志:
-h、--help 显示上下文相关的帮助(也可尝试--help-long 和--help-man)。
--version 显示应用程序版本。
--enable-feature= ... 逗号分隔的要启用的功能名称(仅
和 no-default-scrape-port 有关)。参见
https://prometheus.io/docs/prometheus/latest/feature_flags/ 获取
选项和更多详情。

命令:
help [<command>...] [<命令>...
显示帮助。

检查服务发现 [<flags>] <config-file> <job>
为给定的任务名称执行服务发现并报告结果,包括重新标记。

check config [<flags>] <config-files>...
检查配置文件是否有效。

check web-config <web-config-files>...
检查网络配置文件是否有效。

检查规则 [<flags>] <rule-files>...
检查规则文件是否有效。

检查指标
通过 stdin 传递 Prometheus 指标,以检查其一致性和正确性。

示例

$ cat metrics.prom | promtool check metrics

$ curl -s http://localhost:9090/metrics | promtool check metrics

查询 instant [<flags>] <server> <expr>
运行即时查询。

query range [<flags>] <server> <expr
运行范围查询。

query series --match=MATCH [<flags>] <server> 运行系列查询。
运行系列查询。

query labels [<flags>] <server> <name> 运行标签查询。
运行标签查询。

debug pprof <server
获取剖析调试信息。

debug metrics <server
获取 metrics 调试信息。

debug all <server
获取所有调试信息。

测试规则 <test-rule-file>...
规则的单元测试。

tsdb bench write [<flags>] [<file>] ...
运行写性能基准。

tsdb analyze [<flags>] [<db path>] [<block id>] 数据块 ID
分析搅动、标签对万有引力和压缩效率。

tsdb list [<flags>] [<db path>] 列出 tsdb 块。
列出 tsdb 块。

tsdb dump [<flags>] [<db path>] 从 TSDb 中转储样本。
从 TSDB 转存样本。

tsdb create-blocks-from openmetrics <输入文件> [<输出目录>] 从 OpenMetrics 中导入样本。
从 OpenMetrics 输入导入样本并生成 TSDB 块。请参阅存储文档
了解更多详情。

tsdb create-blocks-from rules --start=START [<flags>] <rule-files>...
为新记录规则创建数据块。


使用 promtool 工具可以很方便地对 Prometheus 规则文件进行校验,判断规则是否合法和符合预期。

基本命令格式为:

1
promtool check rules <rules文件>

这将会对规则文件进行全面检查,包括语法、表达式等都会被验证。

例如:

1
promtool check rules prometheus.rules.yml

如果规则文件存在问题,promtool 会输出错误信息,例如:

1
2
checking prometheus.rules.yml
FAILED: parsing rule file: parse error at line 10, col 10: invalid character '@'

这表示在第10行第10列处发现非法字符‘@’。

如果全部规则都通过校验,会输出:

1
2
checking prometheus.rules.yml
SUCCESS: 0 rules found

所以使用promtool check rules可以方便地在修改规则之前进行校验,避免推送出错误的规则导致监控失败。


promtool校验alertmanager.yml

使用promtool可以方便地对Alertmanager的配置文件alertmanager.yml进行校验,判断其配置是否正确。

基本命令格式:

1
promtool check config alertmanager.yml

这将会全面验证alertmanager.yml的配置,主要检查以下方面:

  • YAML文件格式是否正确
  • 配置块及字段是否合法
  • 引用的模板是否存在
  • route匹配语法是否正确
  • receiver配置是否存在问题

例如:

1
2
3
promtool check config alertmanager.yml
checking alertmanager.yml
SUCCESS: 0 warnings, 0 errors

表示配置文件通过校验,没有错误。

如果存在问题,会输出错误信息,例如:

1
2
checking alertmanager.yml
FAILED: couldn't load configuration (-config.file="alertmanager.yml"): parsing config file: yaml: line 9: mapping values are not allowed in this context

这表示yaml文件第9行有语法错误。

使用promtool检查alertmanager.yml可以帮助我们在修改配置前验证其正确性,避免错配导致报警失败。与CI/CD系统集成也可以在提交代码前自动校验配置。

所以掌握promtool check config命令是管理好Alertmanager的重要一步。


alertmanager工具 amtool 的使用

./amtool silence –help
usage: amtool silence [ …]

Add, expire or view silences. For more information and additional flags see query help

Flags:
-h, –help Show context-sensitive help (also try –help-long and –help-man).
–date.format=”2006-01-02 15:04:05 MST”
Format of date output
-v, –verbose Verbose running information
–alertmanager.url=ALERTMANAGER.URL
Alertmanager to talk to
-o, –output=simple Output formatter (simple, extended, json)
–timeout=30s Timeout for the executed command
–http.config.file=
HTTP client configuration file for amtool to connect to Alertmanager.
–version-check Check alertmanager version. Use –no-version-check to disable.
–version Show application version.

Commands:
silence
add [] […]
expire […]
import [] []
query* [] […]
update [] […]

文章目录