Prometheus(普罗米修斯) 是一种 新型监控告警工具,Kubernetes的流行带动了Prometheus的应用。
全文参考自 prometheus学习笔记(1)-mac单机版环境搭建
Mac上安装Prometheus
brew install prometheus
安装路径在 /usr/local/Cellar/prometheus/2.20.1,
配置文件在 /usr/local/etc/prometheus.yml:
1 | global: |
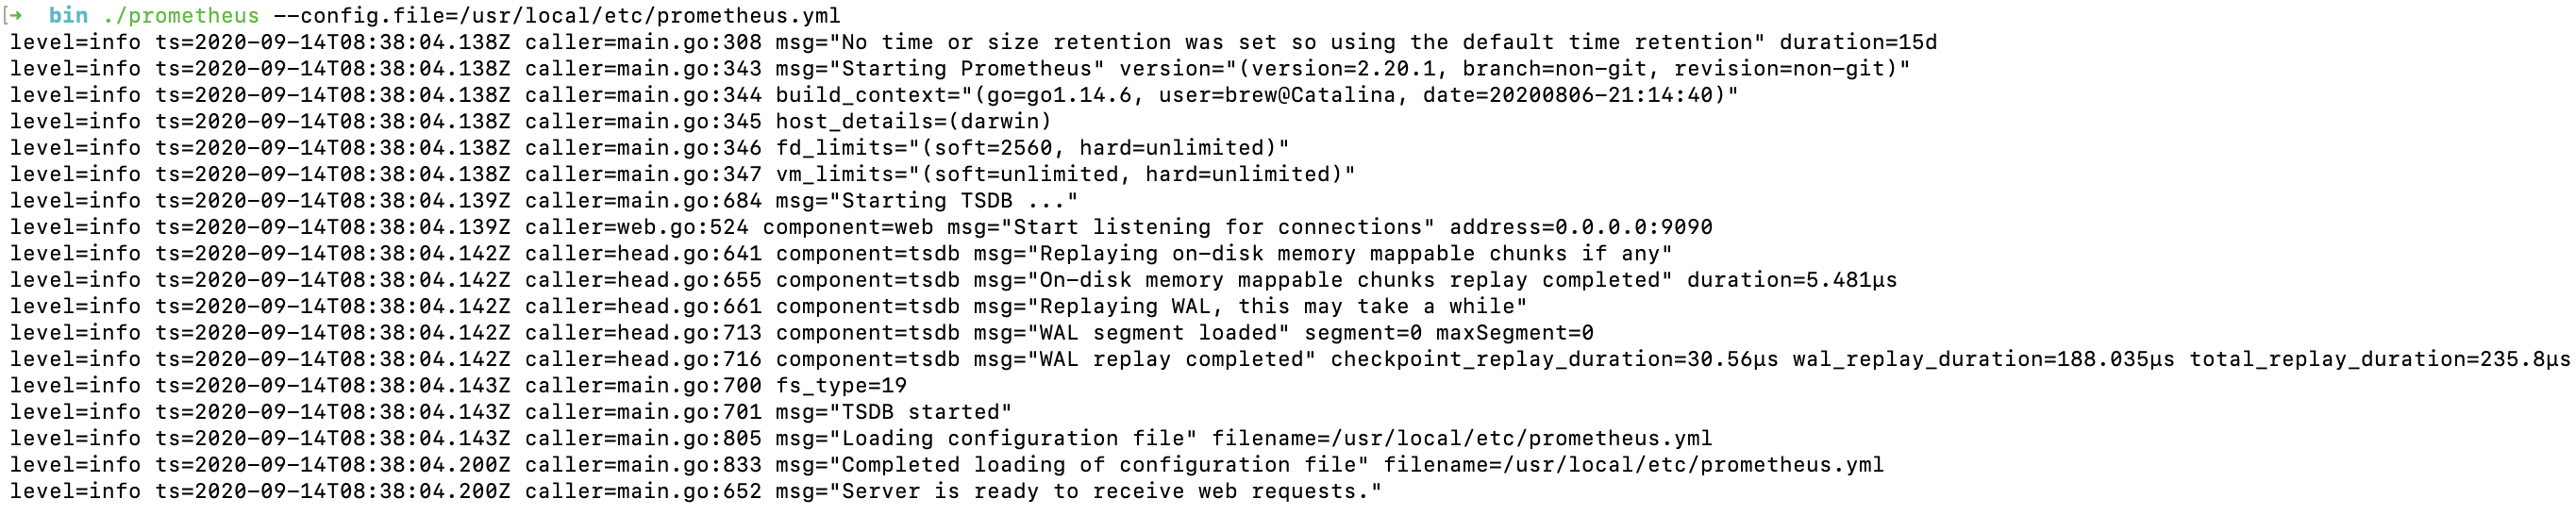
切换到安装目录的bin文件夹,
cd /usr/local/Cellar/prometheus/2.20.1/bin
执行:
./prometheus –config.file=/usr/local/etc/prometheus.yml
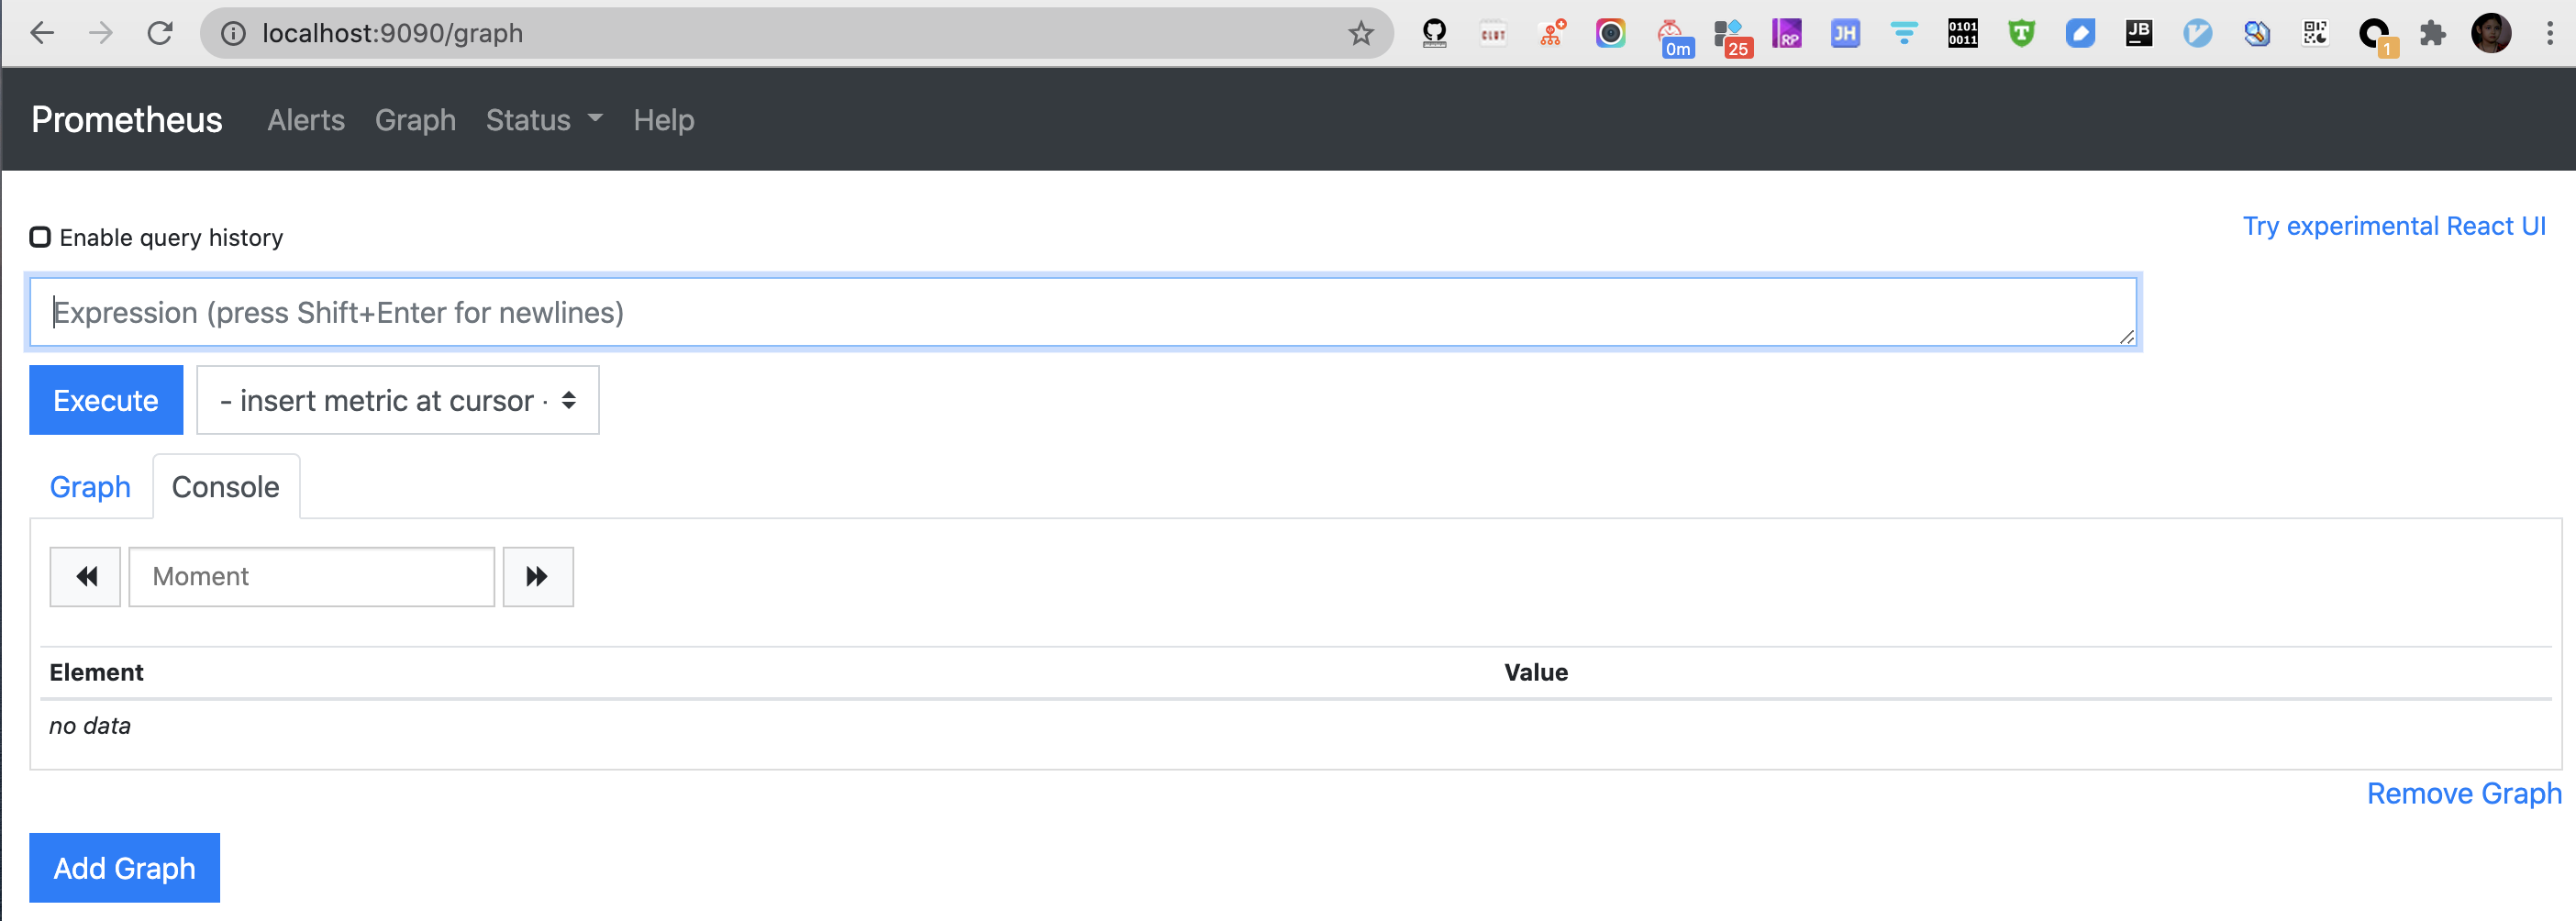
此时可访问localhost:9090,有如下页面:
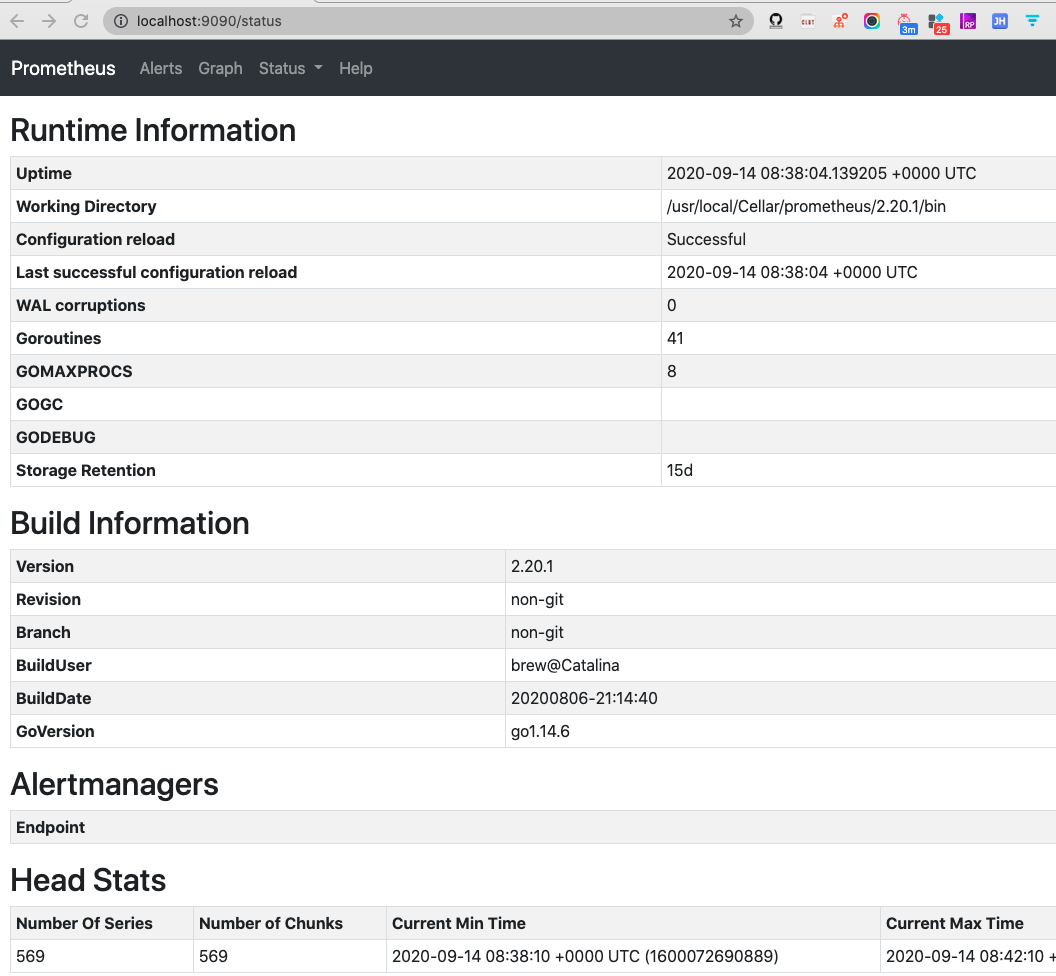
在Status中可以看到若干元信息.
安装grafana
brew install grafana
安装路径在 /usr/local/Cellar/grafana/7.1.5,
配置文件在 /usr/local/etc/grafana/grafana.ini,
可在此修改默认的端口等信息
启动:
grafana-server –config=/usr/local/etc/grafana/grafana.ini –homepath /usr/local/share/grafana –packaging=brew cfg:default.paths.logs=/usr/local/var/log/grafana cfg:default.paths.data=/usr/local/var/lib/grafana cfg:default.paths.plugins=/usr/local/var/lib/grafana/plugins
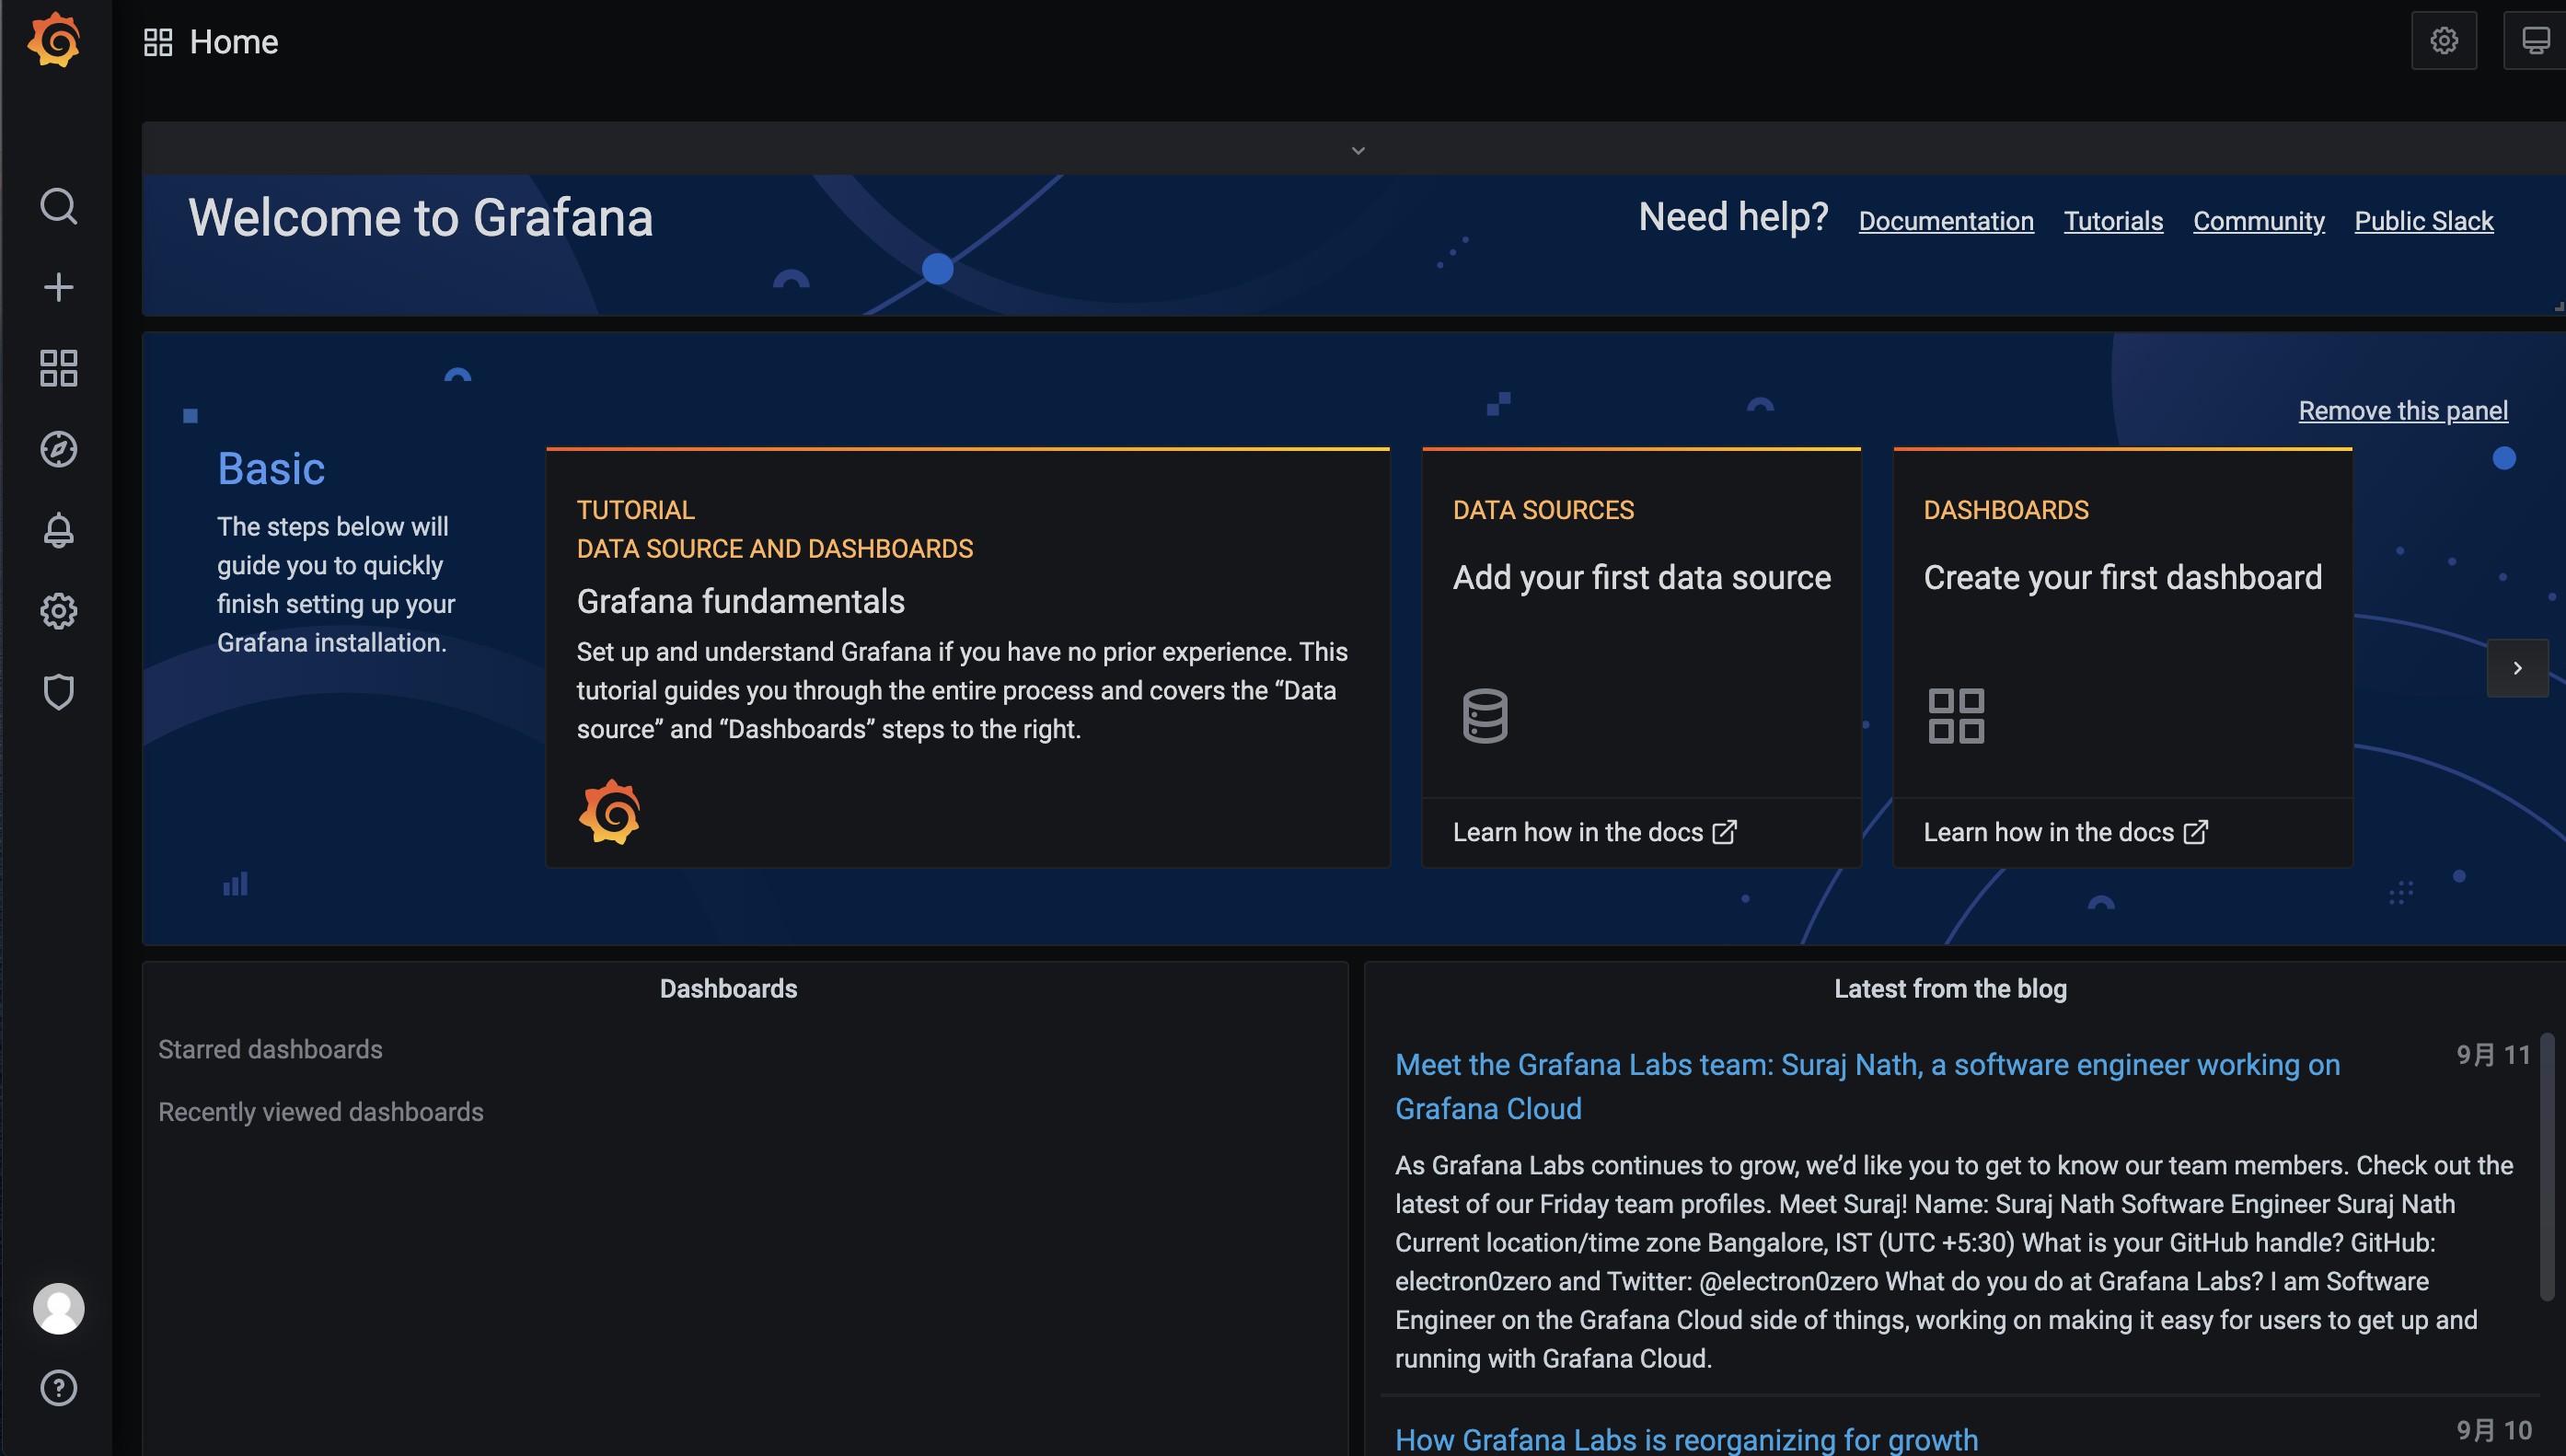
访问localhost:3000,有如下页面:
(默认的用户名/密码均为admin,首次登陆必须修改密码)
Grafana 是一个单纯的前端图表展示工具, 必须为其添加数据源,才能读取到数据进而进行展示, 参考下图:
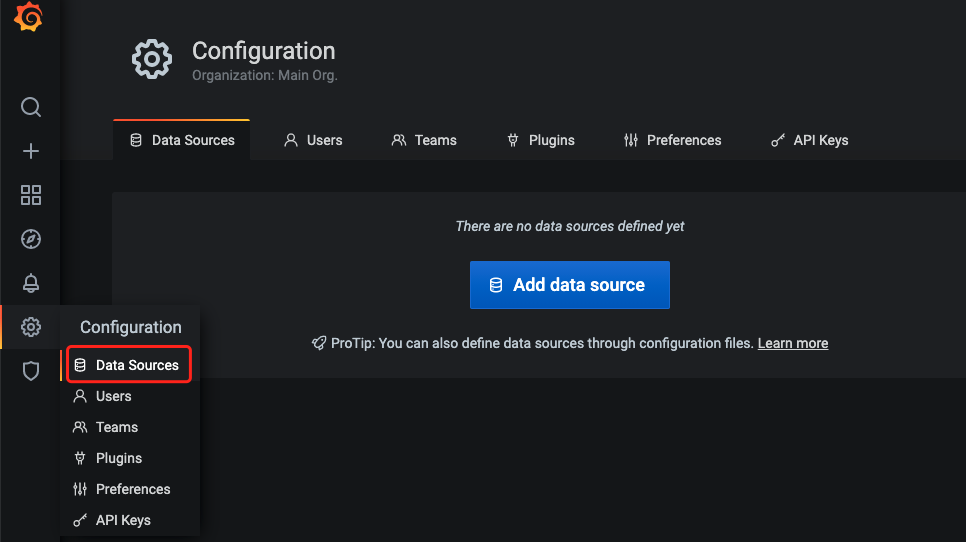
Grafana 支持非常多的数据源.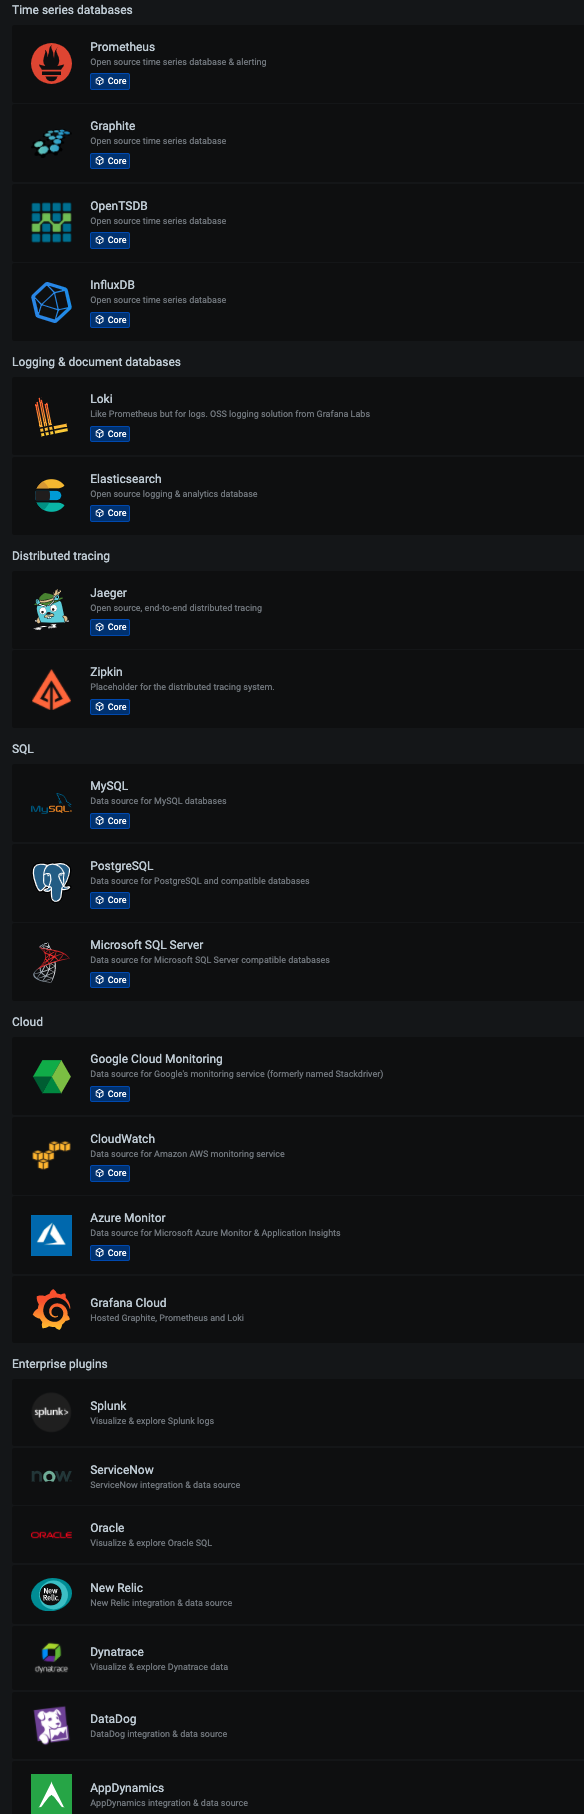
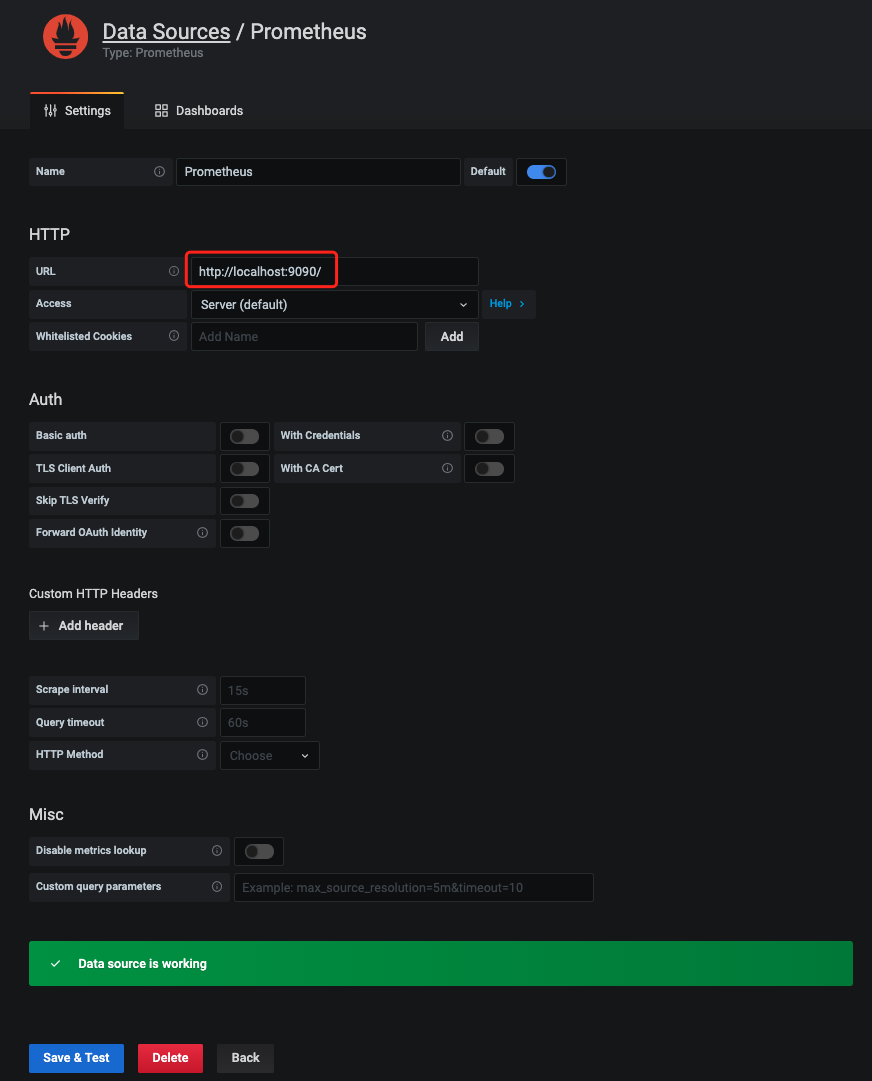
选择Prometheus数据源, 指定URL地址, 然后保存即可
安装pushgateway
在 Prometheus官网搜索pushgateway, 下载 pushgateway-1.2.0.darwin-amd64.tar.gz
本地解压,运行
./pushgateway
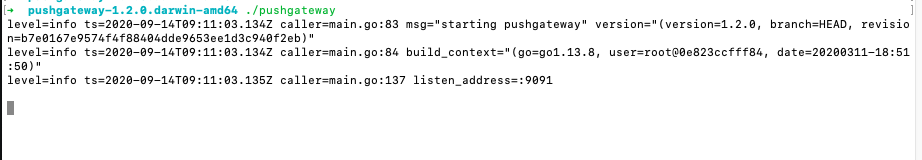
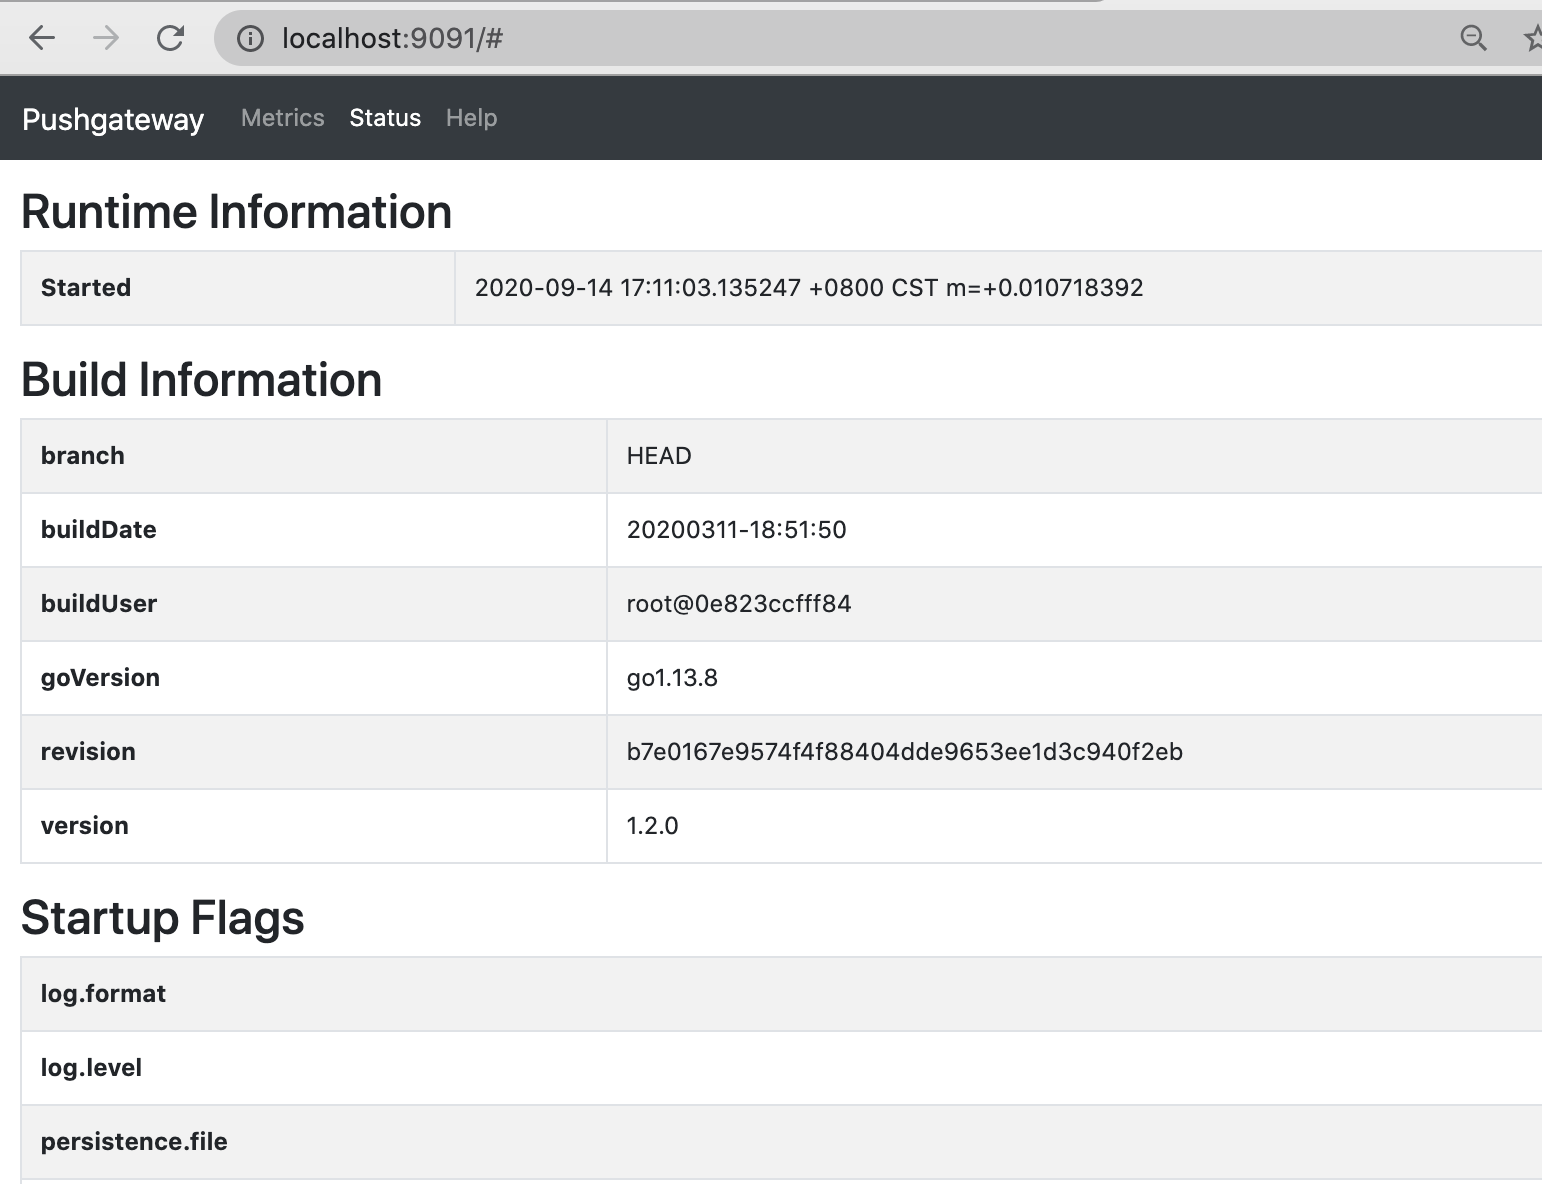
此时, 在localhost:9091/页面Status这个Tab页,可见:
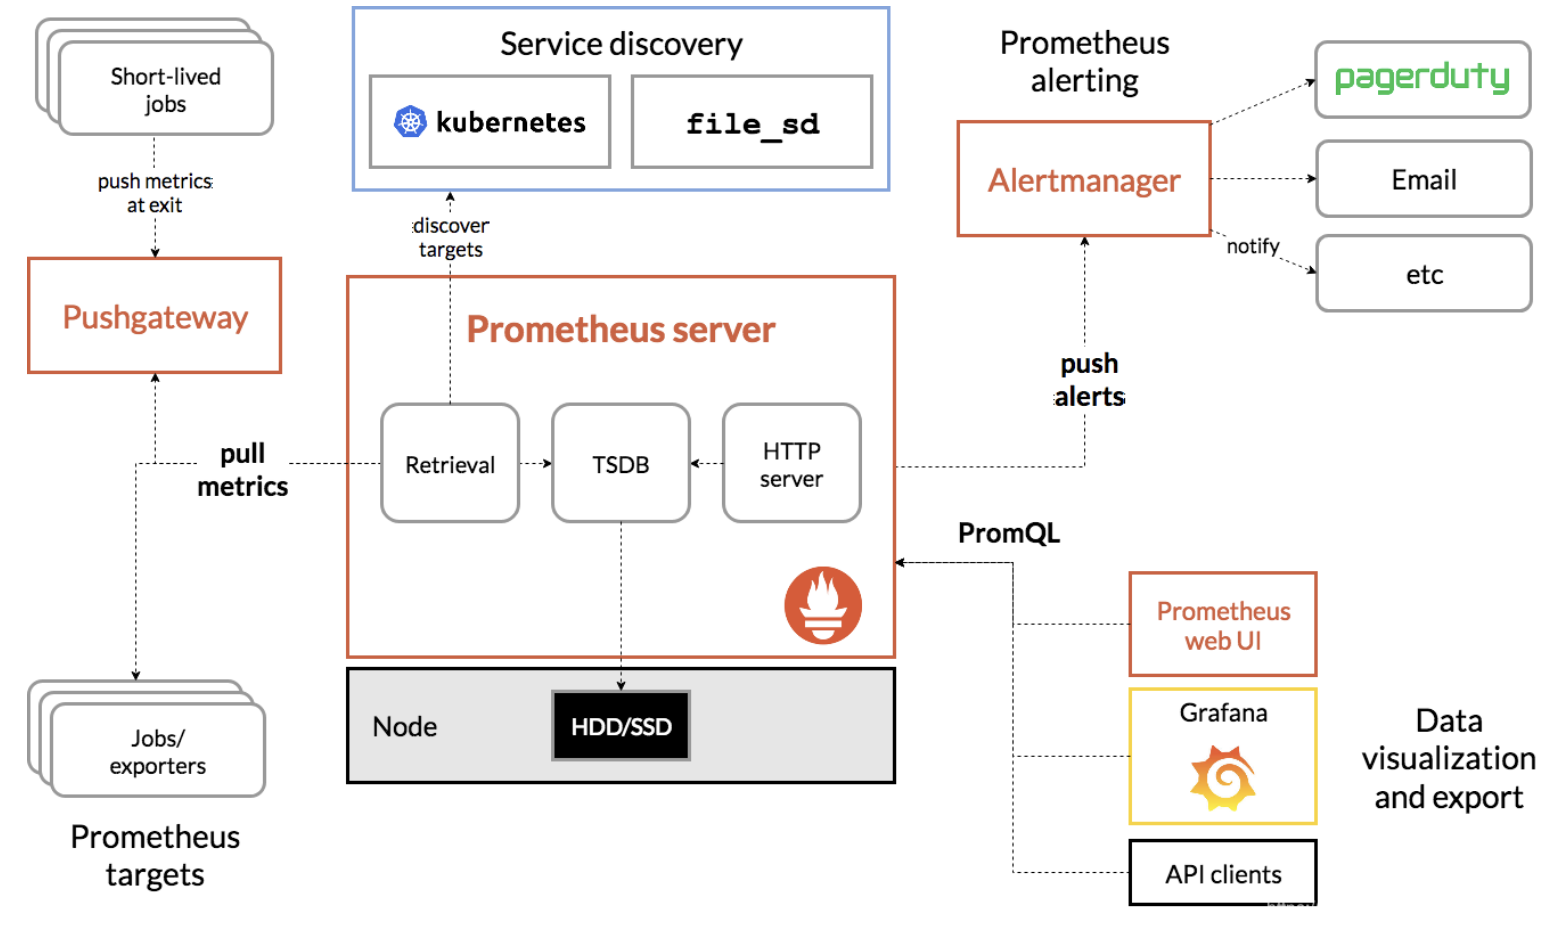
pushgateway的作用:(图片来自网络)
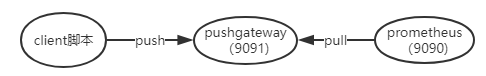
(图片来自煎鱼大佬的 Prometheus 快速入门)
即 客户端(不管是通过代码, 还是直接终端敲命令行) 将数据push到网关(pushgateway), 然后Prometheus从网关pull数据
修改Prometheus的配置文件
vim /usr/local/etc/prometheus.yml
增加如下几行,重启Prometheus,以让新的配置文件生效.
1 | - job_name: "push-metrics" |
(Prometheus提供了多种语言的sdk, 最简单的方式是通过shell)
推送一个指标:
1 | echo "cui_metric 100" | curl --data-binary @- http://localhost:9091/metrics/job/dashen_blog |
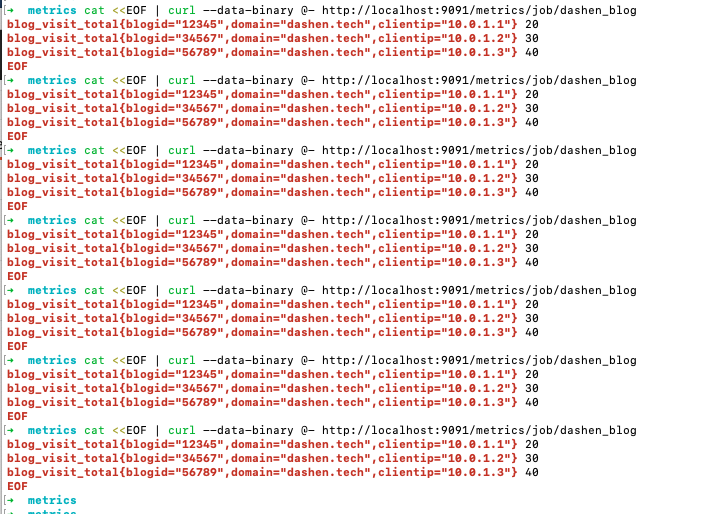
推送多个指标:
1 | cat <<EOF | curl --data-binary @- http://localhost:9091/metrics/job/dashen_blog |
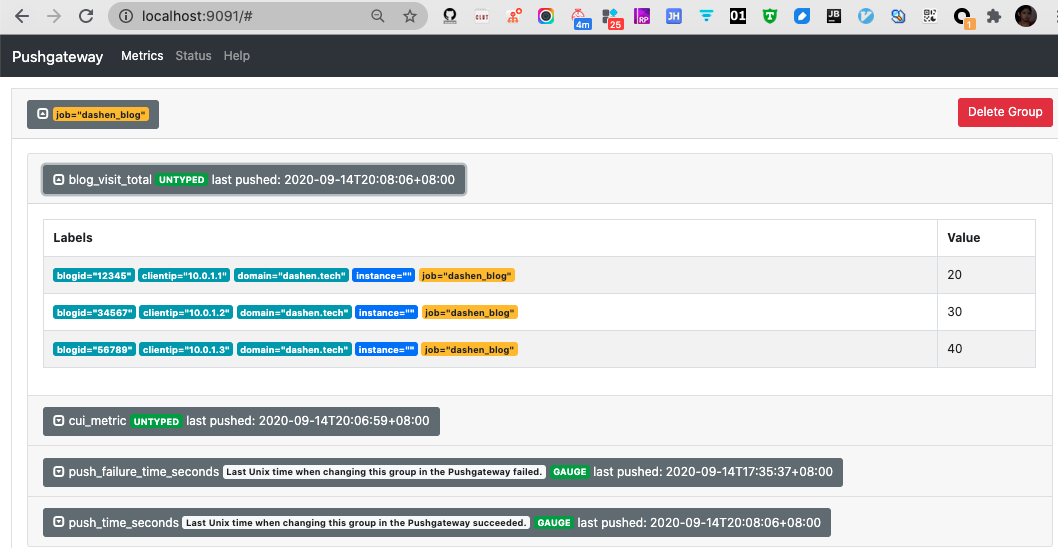
blog_visit_total相当于指标名称,{ }中的内容相当于tag,在查询时可根据tag进行过滤,最后的20、30、40相当于具体的指标值。
dashen_blog是job名称, 可根据需要修改
此时http://localhost:9091上, 已能看到刚才push的数据:
http://localhost:9090, Prometheus里也能感知刚添加的数据
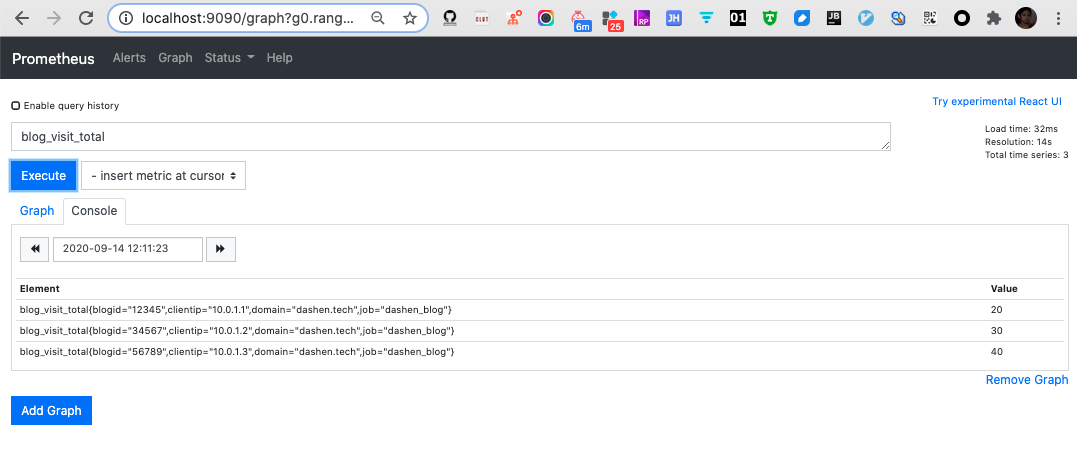
Prometheus本质上是一个时序数据库. curl命令可以多执行几次, 相当于持续向时序数据库中写入数据.
配置Grafana
1.新建Dashboard
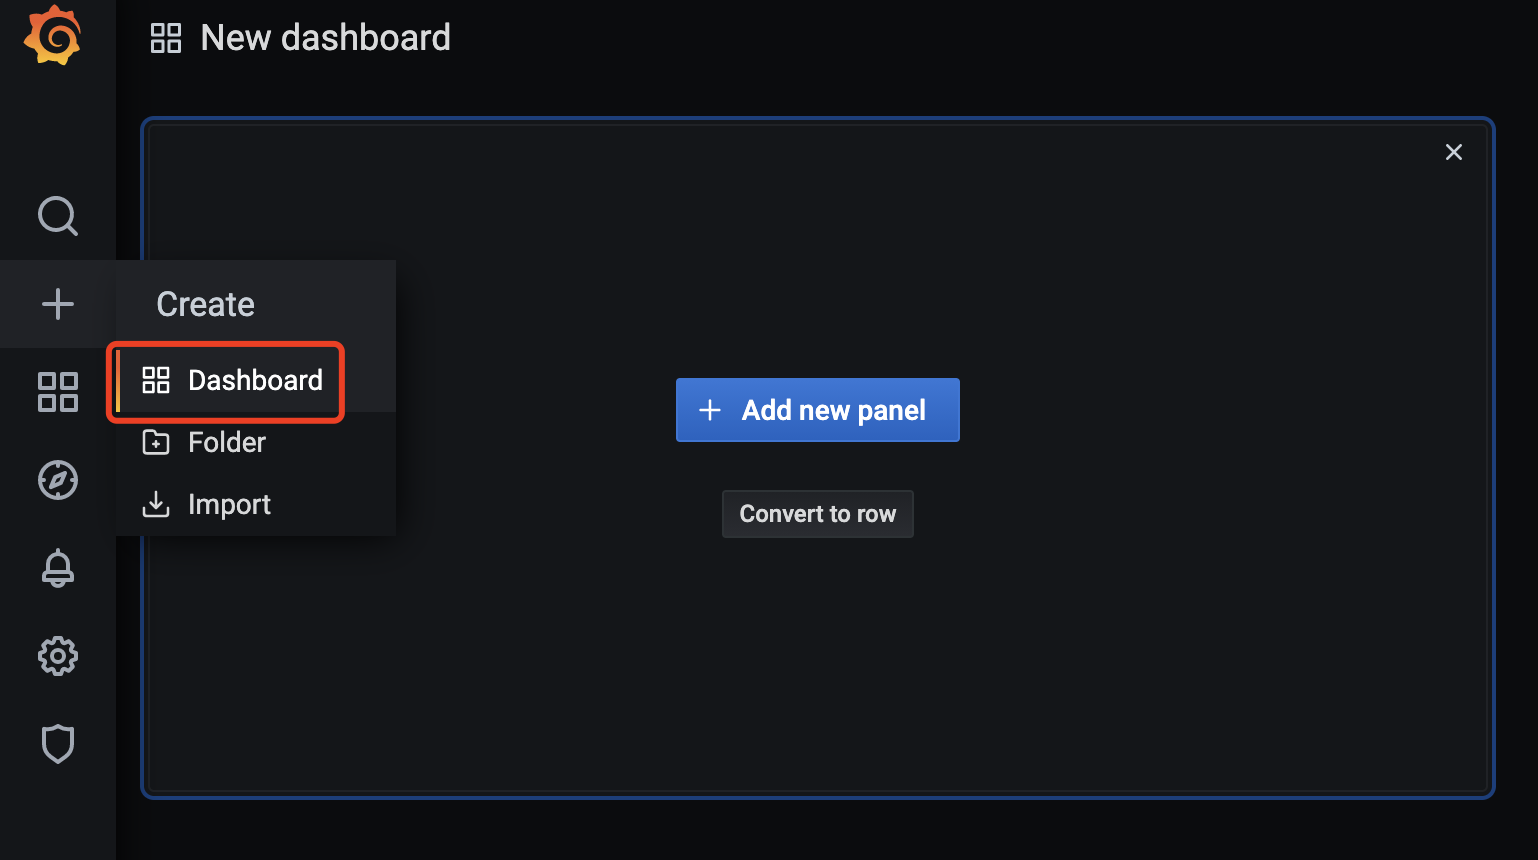
可在设置中进行相关修改
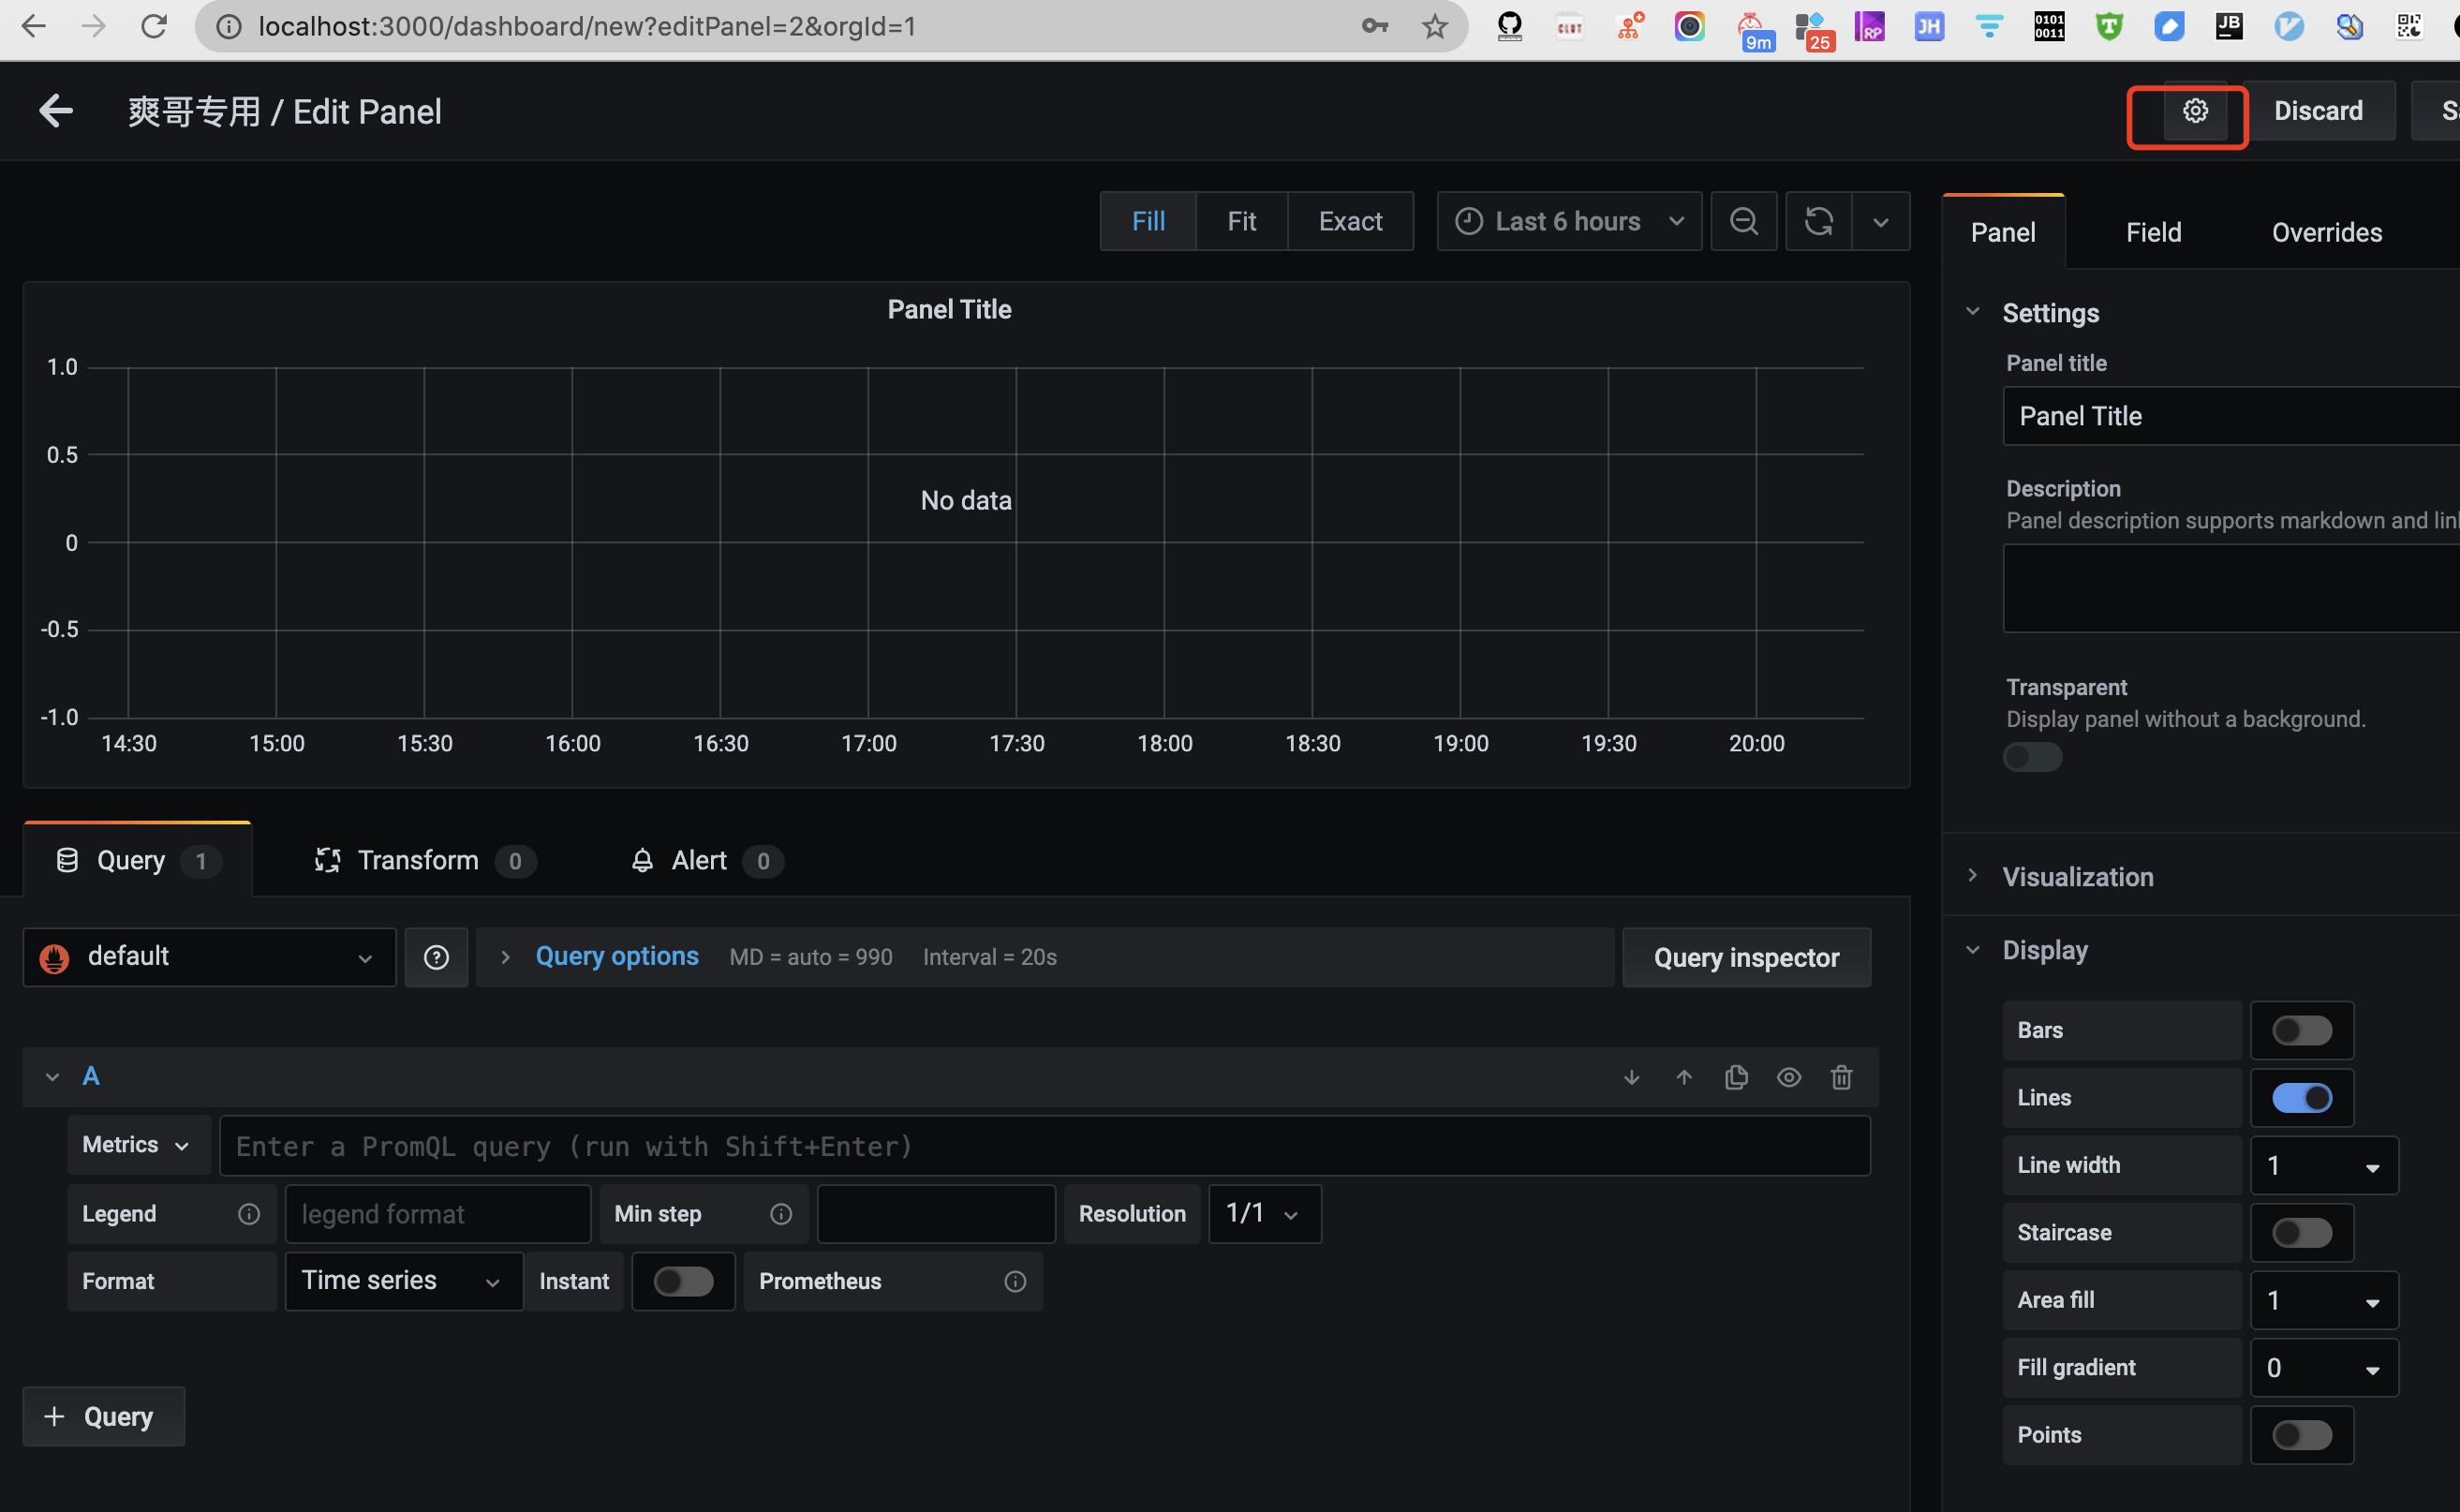
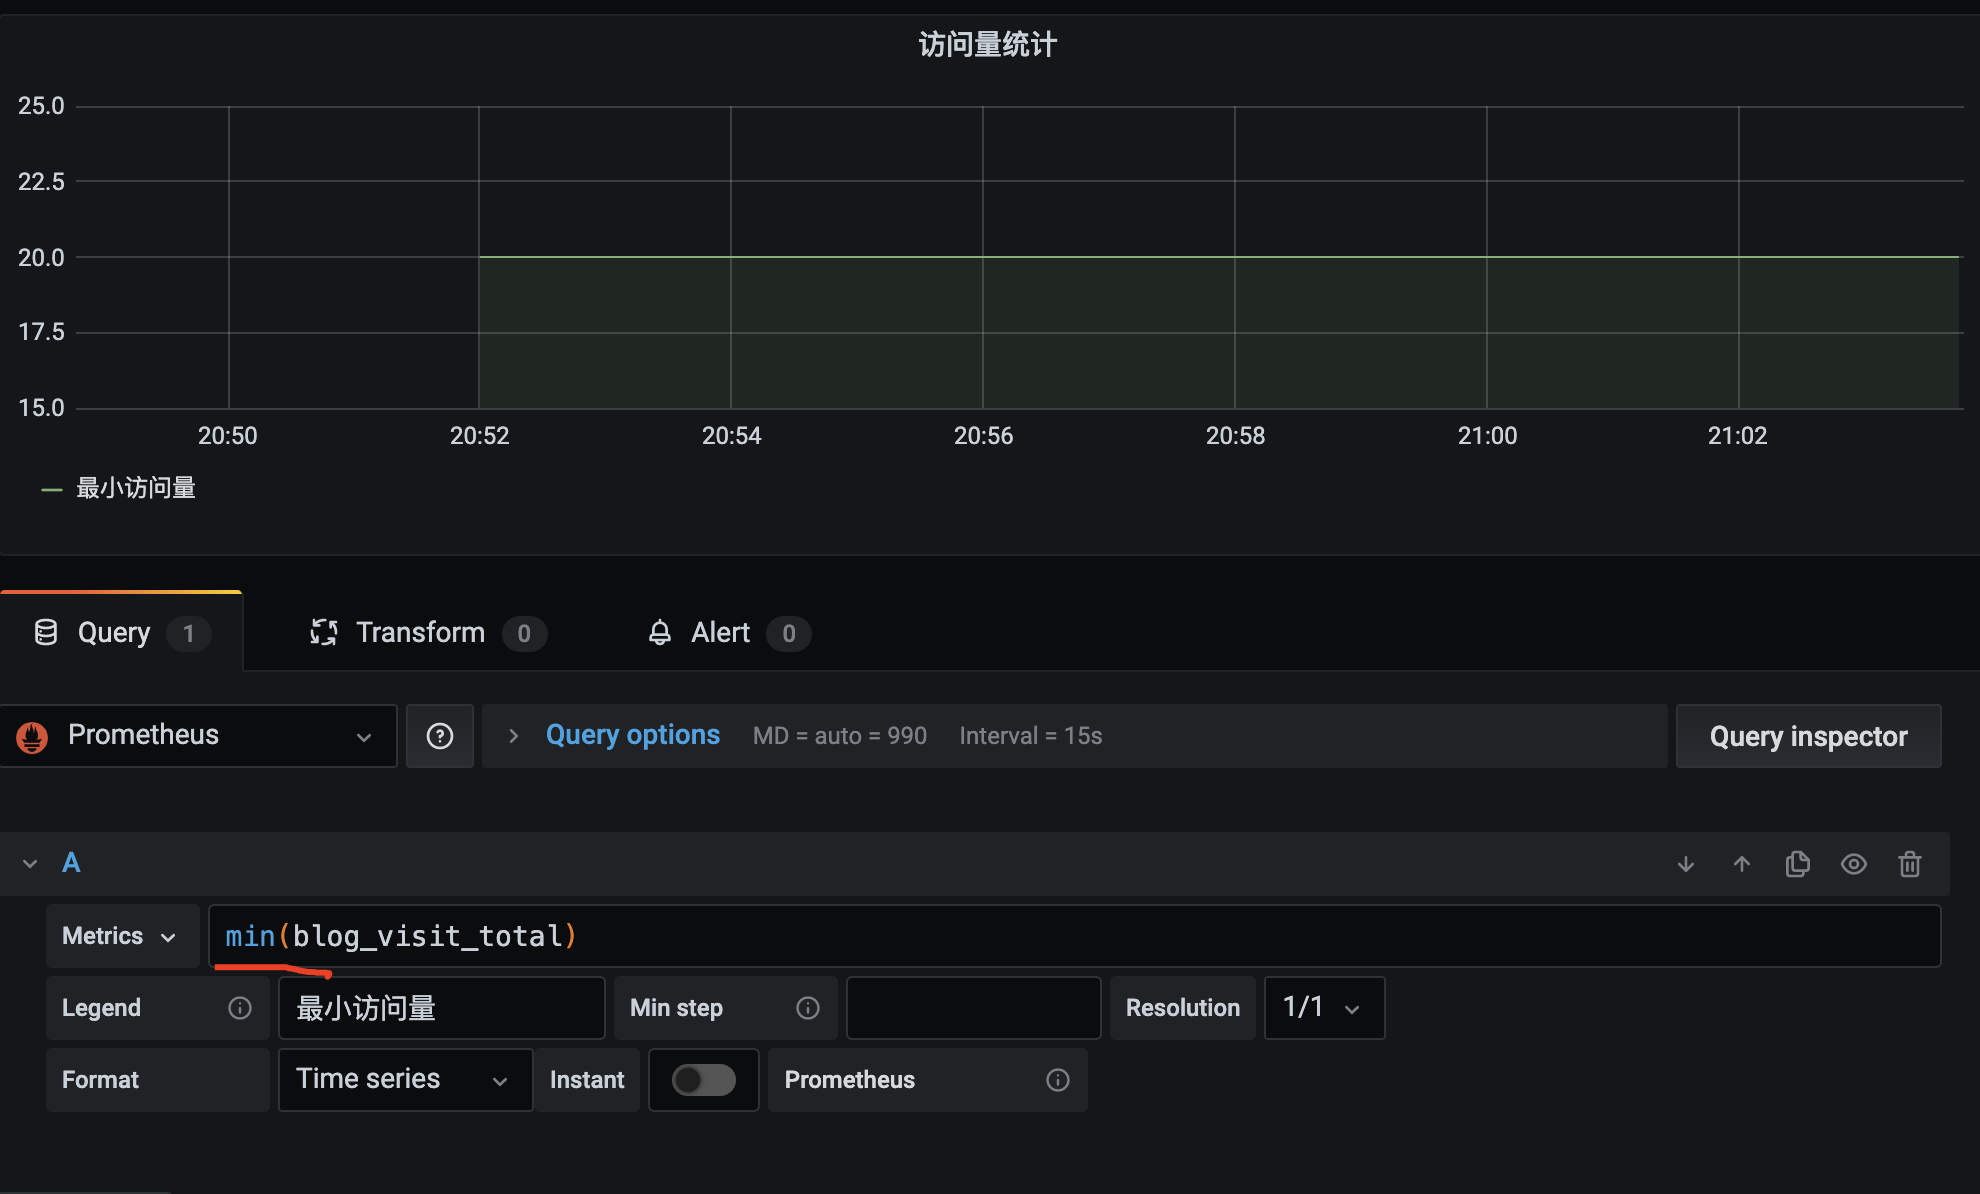
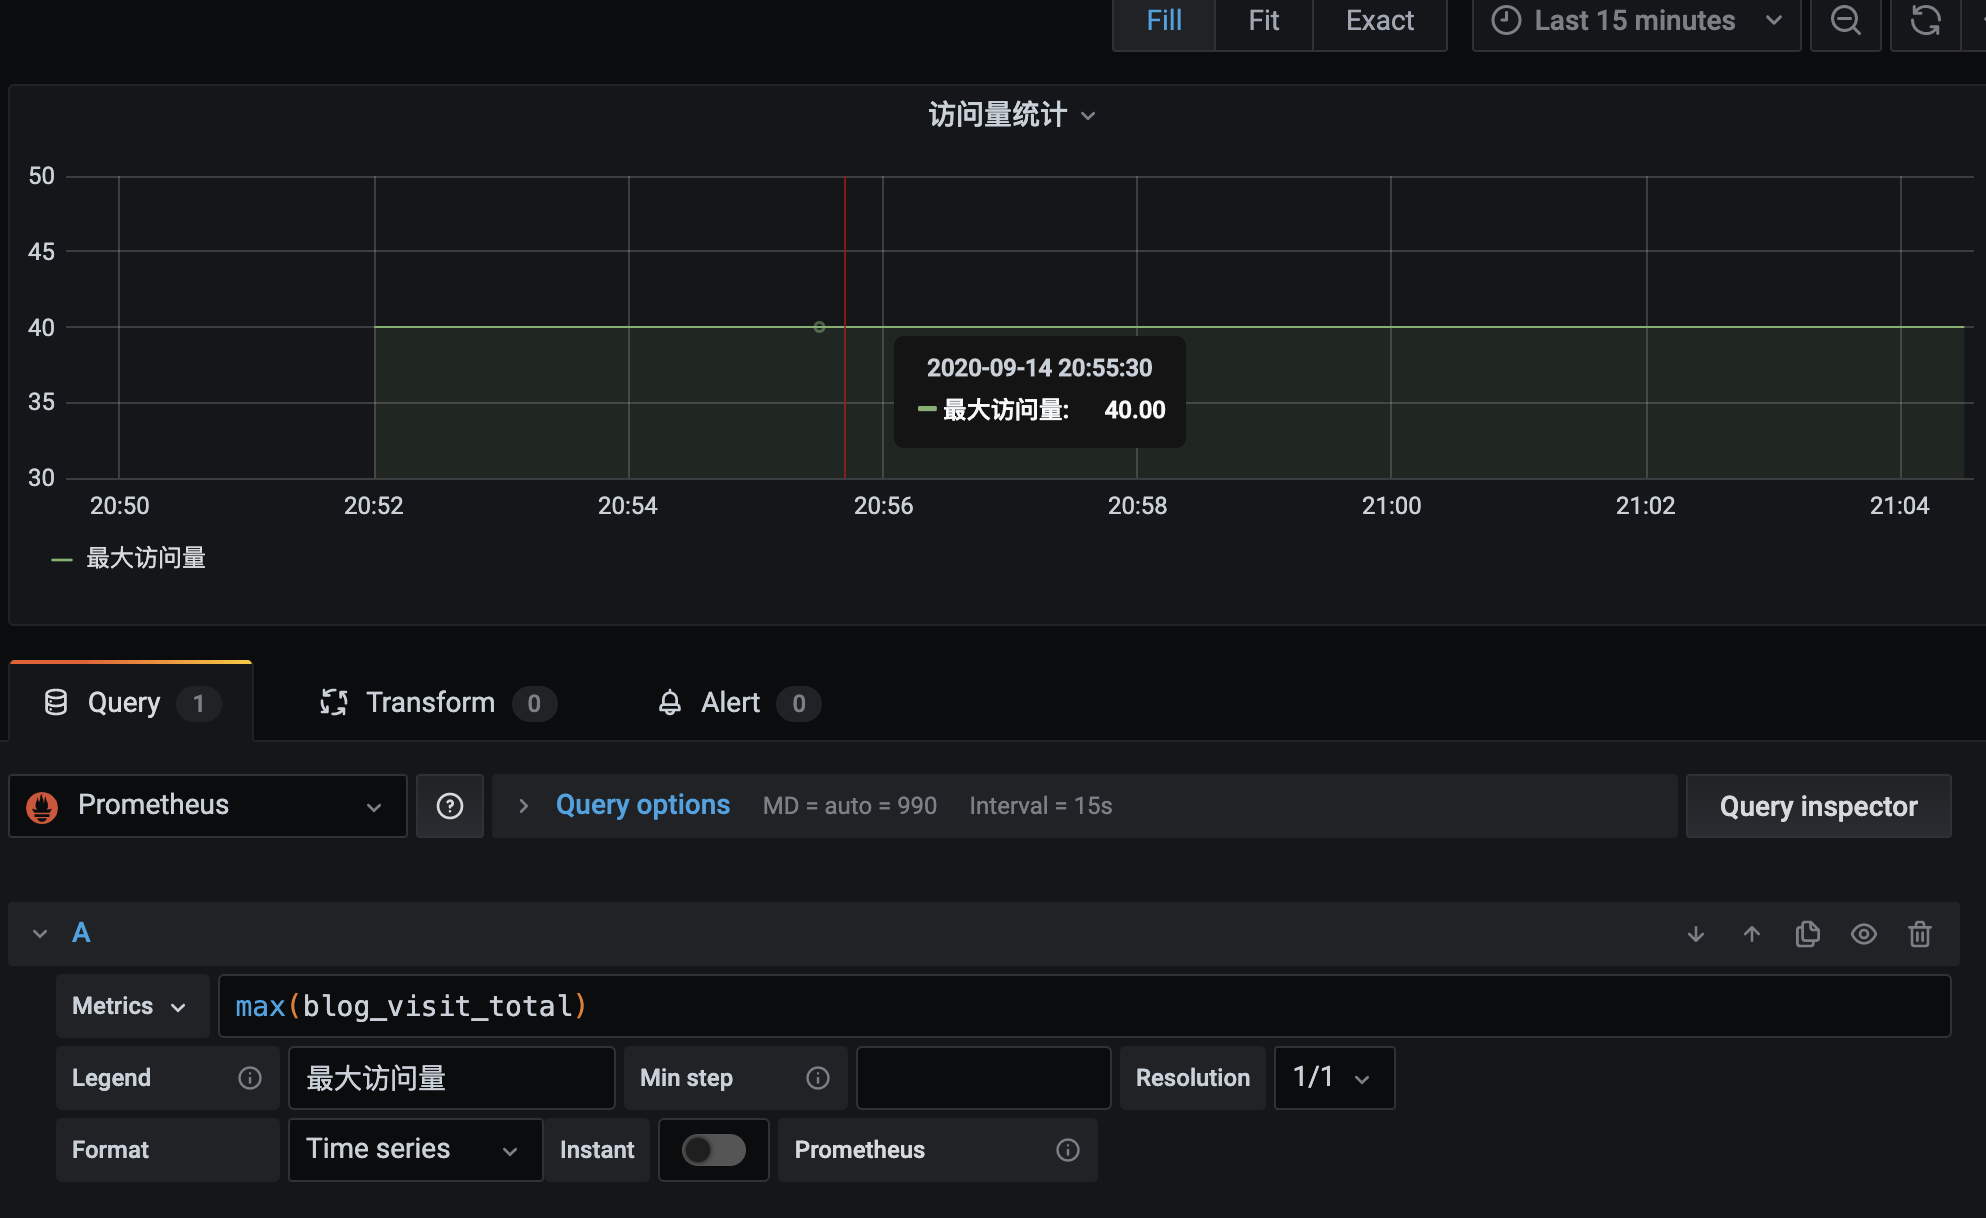
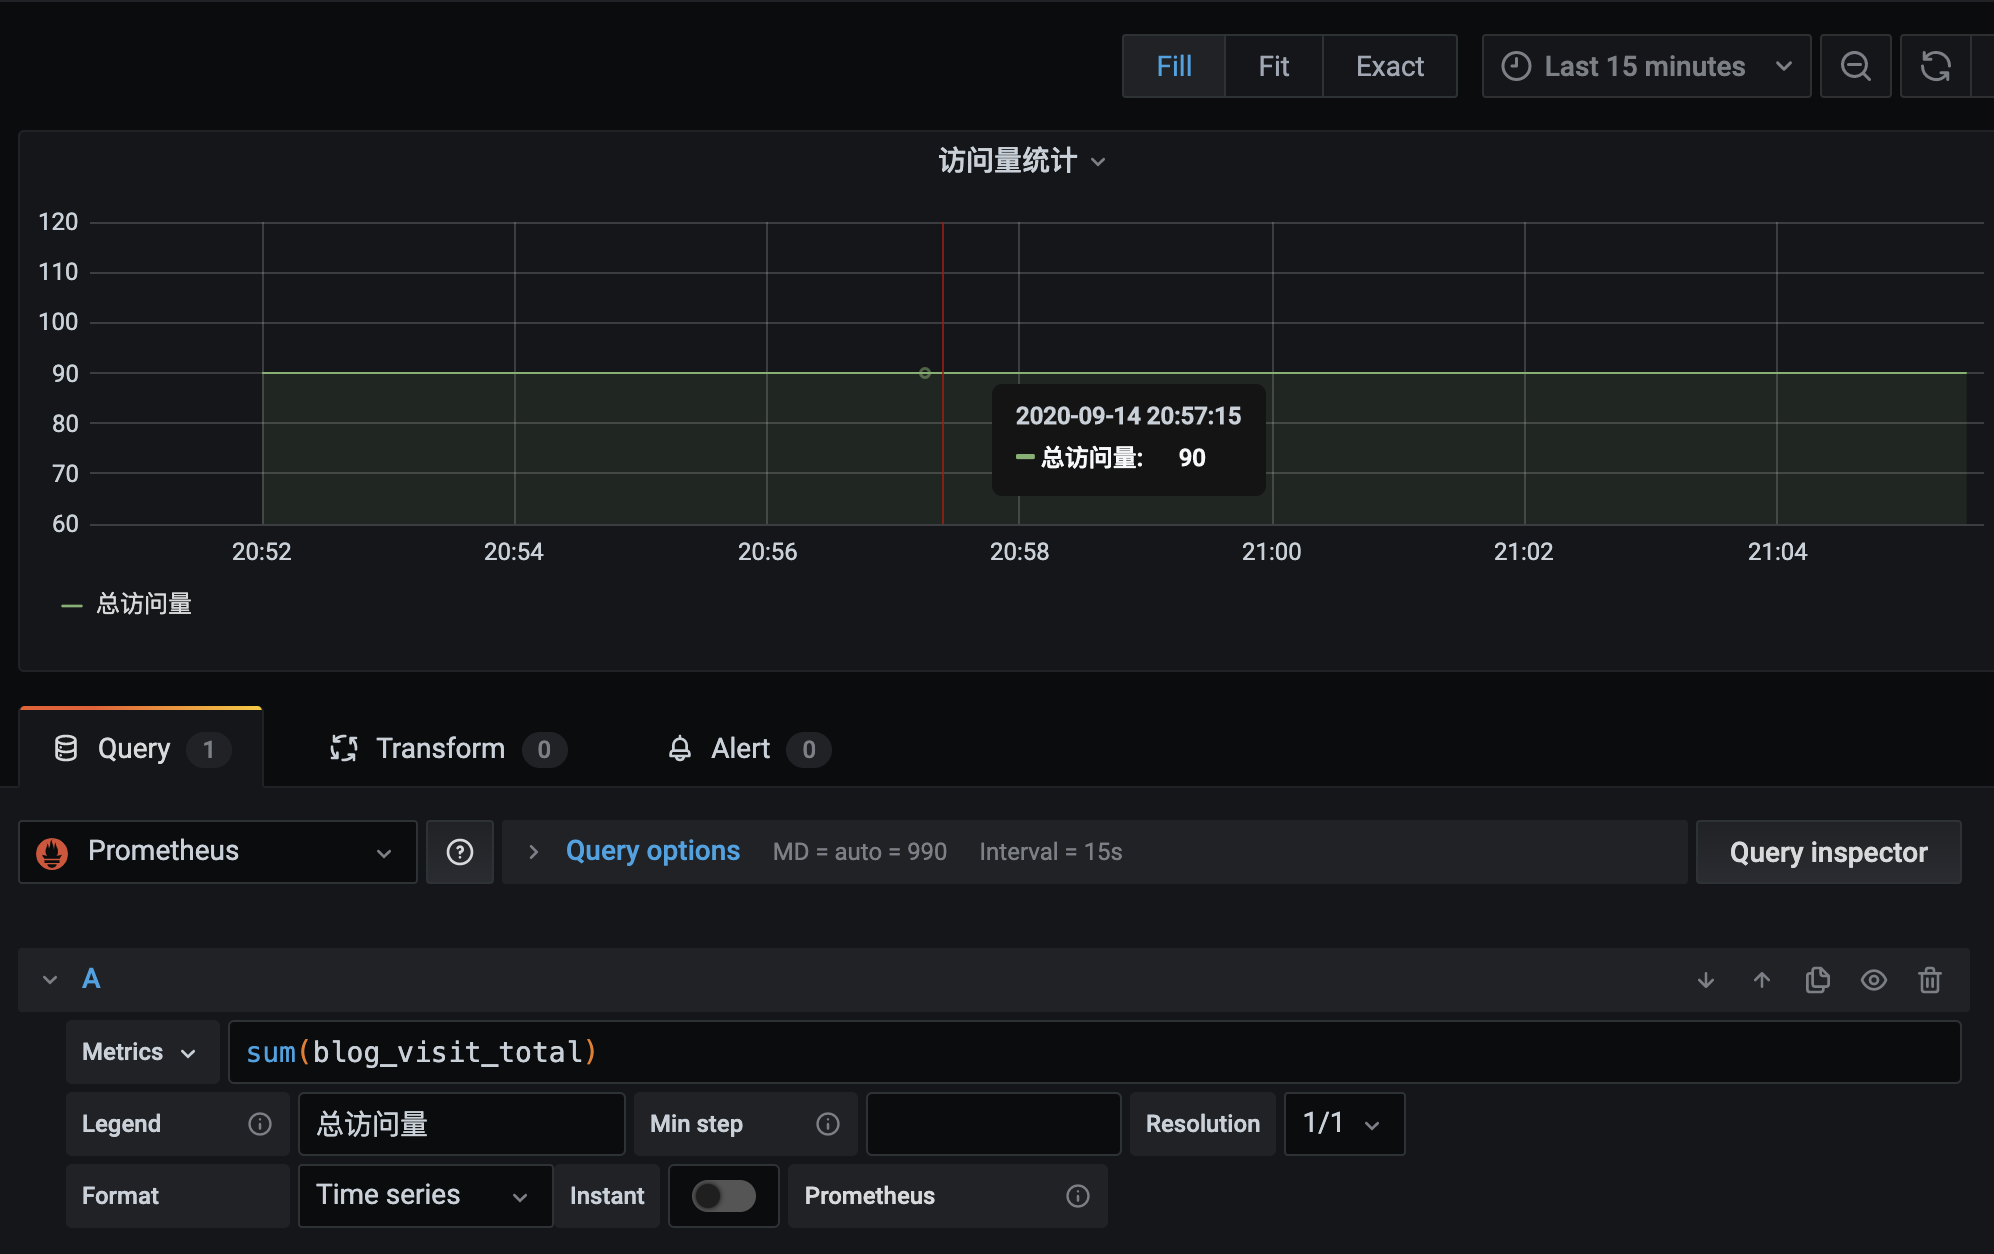
2.添加图表
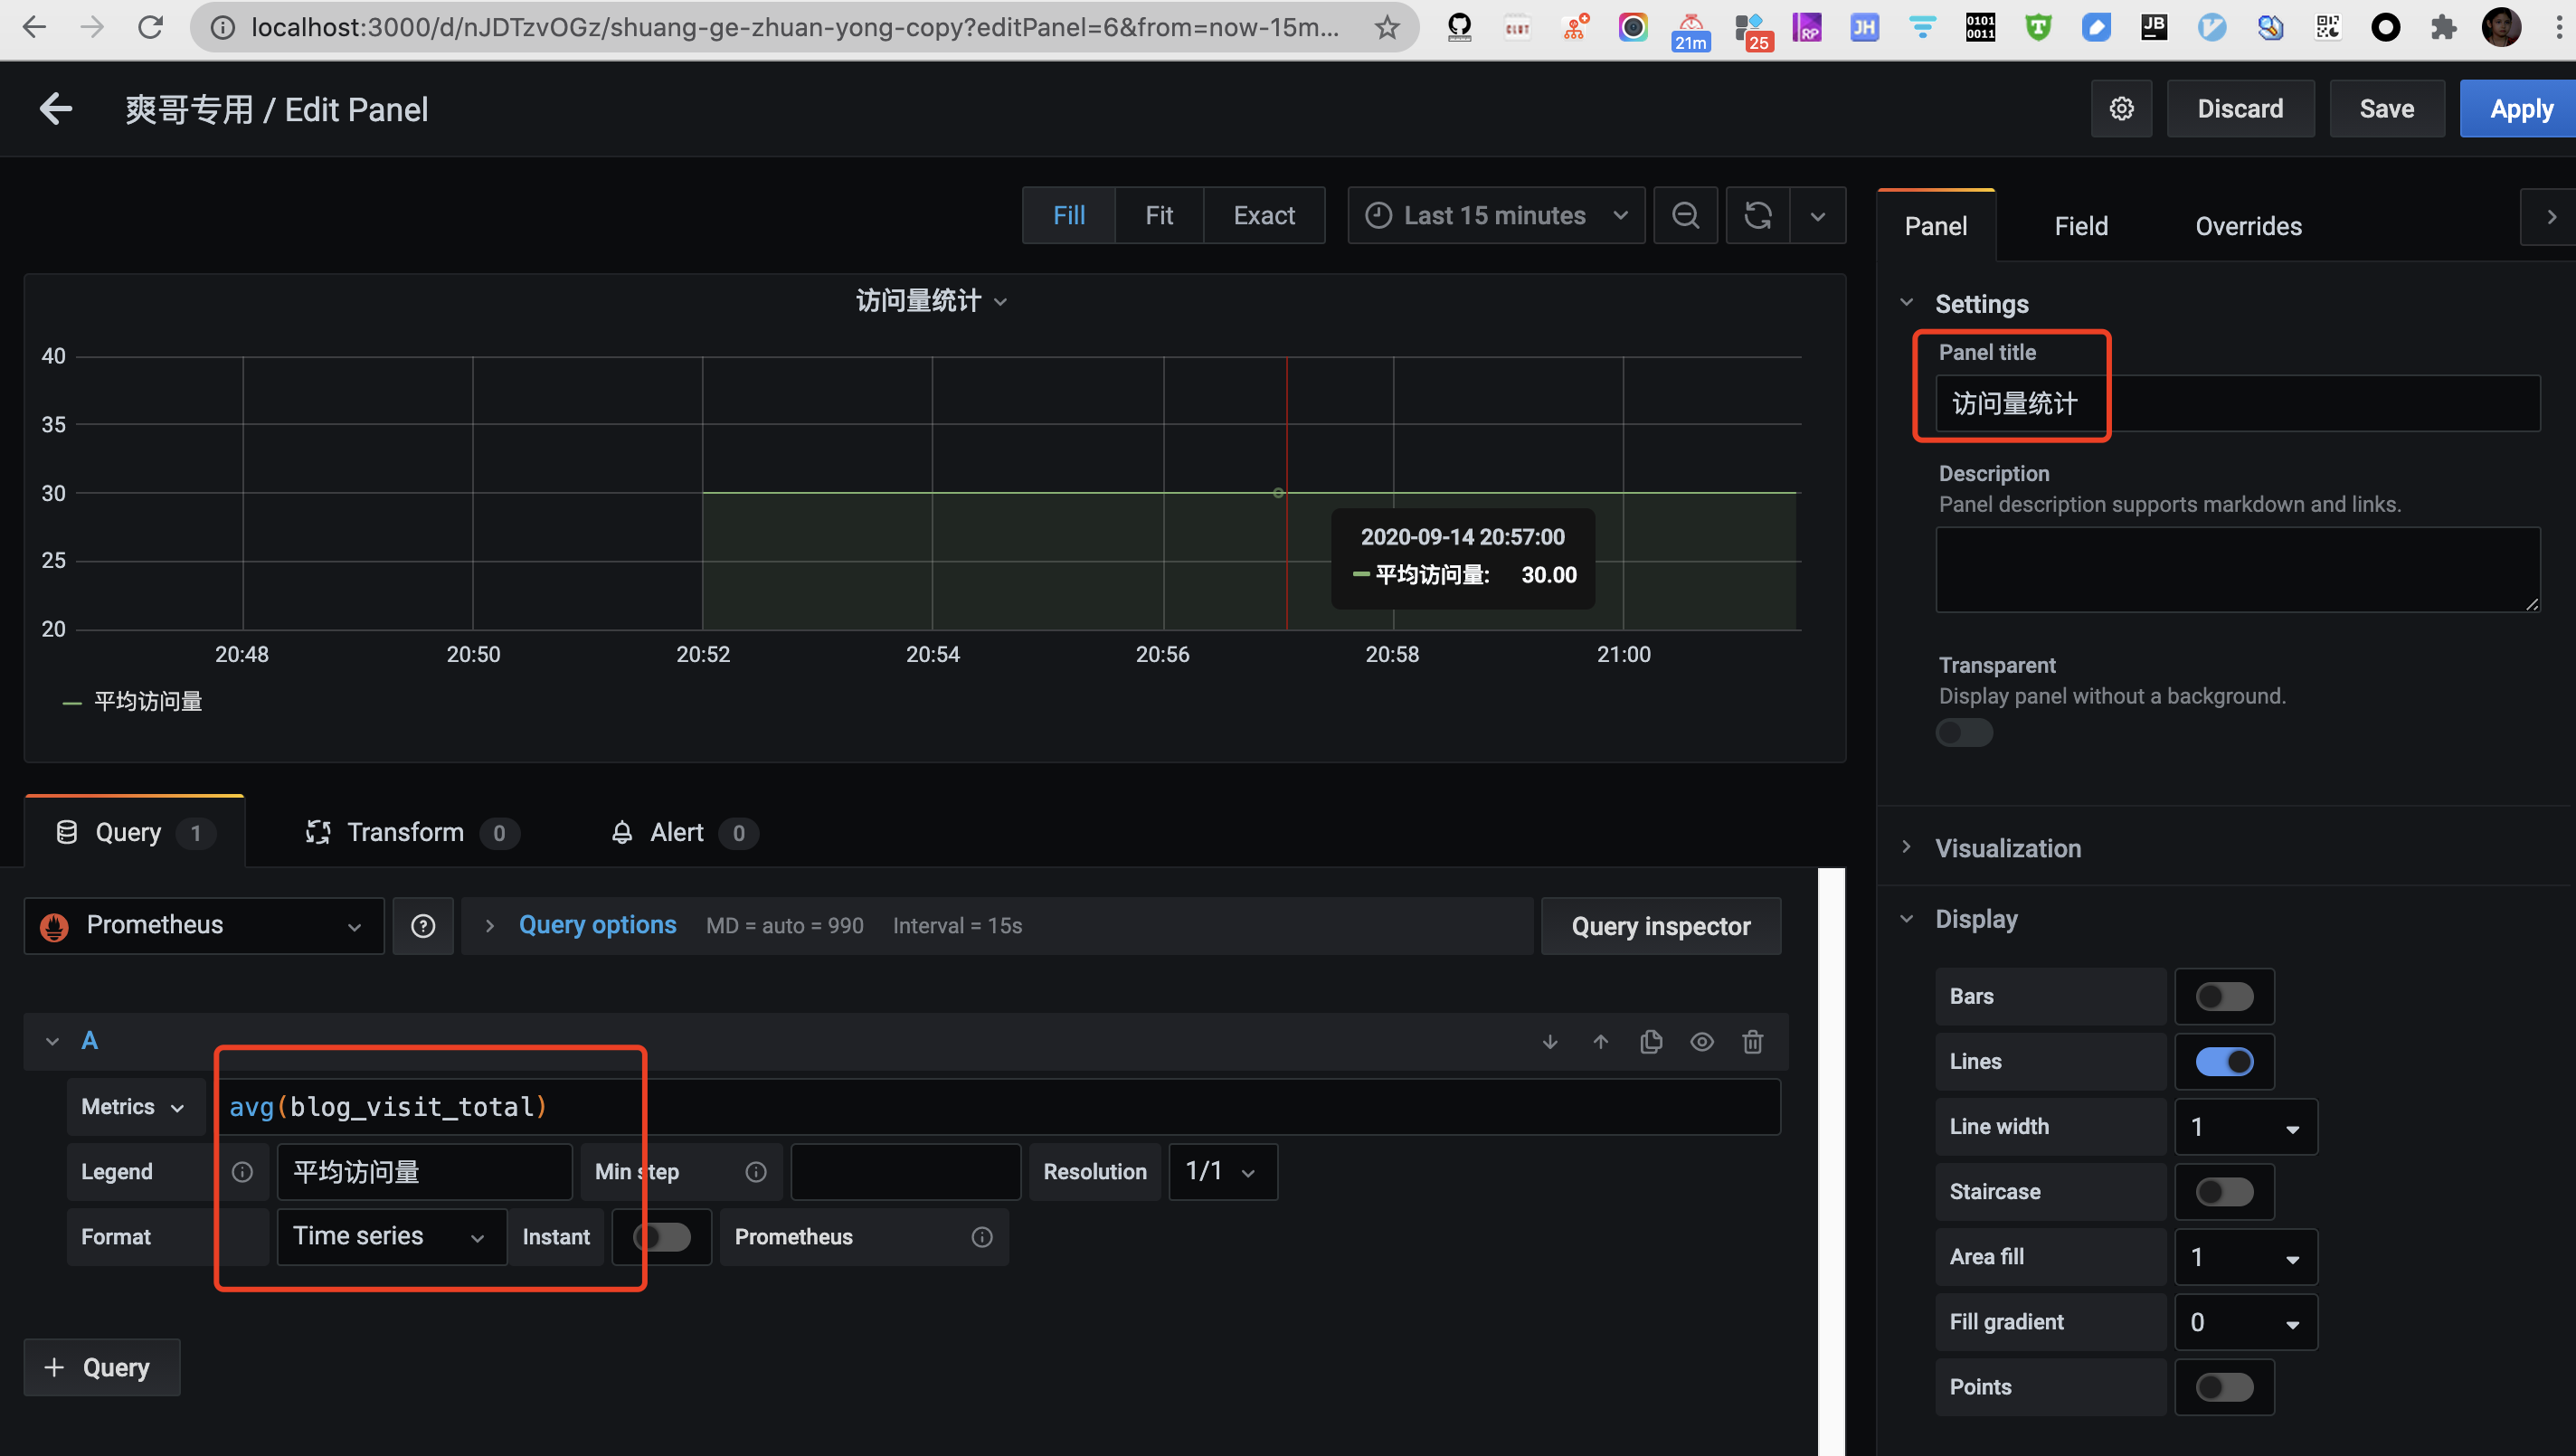
(可以用sum/max/min/avg这类聚合函数统计指标)
参考&进阶:
新型监控告警工具prometheus(普罗米修斯)的入门使用
Prometheus 推拉
Prometheus是一个开源的监控系统,具有强大的查询语言和数据模型,用于收集和存储时间序列数据。Prometheus通过pull模型从被监控的目标(如服务器、容器等)中获取数据,然后将其存储在本地数据库中。Prometheus还提供了一种称为pushgateway的组件,用于允许被监控的目标通过push模型向Prometheus推送指标数据。
在pull模型中,Prometheus通过HTTP协议从被监控的目标中拉取数据。被监控的目标必须运行一个称为exporter的组件,用于暴露指标数据的HTTP接口。Prometheus定期通过该接口获取指标数据。
在push模型中,被监控的目标将指标数据推送到一个称为pushgateway的中间代理组件中。然后,Prometheus定期从pushgateway中获取指标数据。推送数据的方式对于一些短暂存在的任务非常有用,比如批处理作业、临时性的任务等等,因为这些任务在Prometheus抓取数据之前就已经消失了,导致这些指标数据无法被Prometheus采集。
[Prometheus学习笔记(1)Prometheus架构简介]
原文链接: https://dashen.tech/2020/09/14/prometheus入门/
版权声明: 转载请注明出处.