想要将 Watchdog 告警去掉(Taskon服务的,每4h抛一次,用于整体探,告诉我这个服务还在)
1 | [FIRING:1] Watchdog (monitoring/prometheus-kube-prometheus-prometheus none) |
现在想去掉这个告警。和二进制部署的prometheus不同,K8s环境下有点麻烦
k -n monitoring get PrometheusRule
1 | NAME AGE |
命令 “k -n monitoring get PrometheusRule” 是一个使用 Kubernetes 命令行工具(kubectl)查询 Kubernetes 集群中的监控规则(PrometheusRule)资源的命令。
解析该命令的具体含义如下:
- “k”:是 “kubectl” 命令的简写形式,用于与 Kubernetes 集群进行交互。
- “-n monitoring”:是一个命令行参数,指定要在名为 “monitoring” 的命名空间中执行操作。命名空间是 Kubernetes 中用于逻辑隔离和组织资源的一种机制。
- “get”:是一个 kubectl 命令,用于获取指定资源的信息。
- “PrometheusRule”:是要获取的资源类型,它表示 Prometheus 监控规则。PrometheusRule 是用于配置和定义 Prometheus 监控系统中的告警规则的 Kubernetes 资源类型。
因此,该命令的目的是在名为 “monitoring” 的命名空间中获取所有的 PrometheusRule 资源的信息。执行该命令后,kubectl 将返回 PrometheusRule 资源的详细信息,包括其名称、标签、配置规则等。这些信息可以用于监控和管理 Prometheus 监控系统中的告警规则。
如何查看watchdog这个规则配置,在哪个里面?
要查看名为 “watchdog” 的规则配置在哪个文件或位置中,需要进一步了解你使用的具体监控系统或工具。”watchdog” 可能是一个自定义的规则名称,它的具体配置位置可能因不同的监控系统而异。
通常,Prometheus 监控系统中的规则配置通常存储在 Prometheus 的配置文件中或者通过 Kubernetes 的 PrometheusRule 资源来定义。以下是两种常见的情况:
Prometheus 配置文件:在 Prometheus 的配置文件(通常为
prometheus.yml)中,可以指定规则文件的位置。在该文件中,可以通过rule_files配置项指定一个或多个规则文件的路径。可以在配置文件中搜索rule_files配置项,查看是否有指定的规则文件路径,然后定位到该文件并查找名为 “watchdog” 的规则配置。Kubernetes 的 PrometheusRule 资源:如果你在 Kubernetes 集群中使用 Prometheus Operator 或类似的工具来管理 Prometheus 监控系统,那么规则配置通常会以 PrometheusRule 资源的形式存在于 Kubernetes 中。你可以使用以下命令来获取名为 “watchdog” 的 PrometheusRule 资源的详细信息:
kubectl -n <namespace> get PrometheusRule watchdog -o yaml1
2
3
4
5
6
7
8
9
10
11
12
13
14
15
16
17
18
19
20
21
22
23
24
25
26
27
28
29
30
31
32
33
34
35
36
37
38
39
40
41
42
43
44
45
46
47
48
49
50
51
52
53
54
55
56
57
58
59
60
61
62
63
64
65
66
67
68
69
70
71
72
73
74
75
76
77
78
79
80
其中,`<namespace>` 是 PrometheusRule 所在的命名空间。该命令将返回名为 "watchdog" 的 PrometheusRule 资源的 YAML 配置。你可以查看该配置中的规则定义部分,以了解 "watchdog" 规则的具体配置。
请注意,以上是一些常见的情况,实际的配置位置可能因具体的监控系统和部署方式而有所不同。如果以上方法无法找到 "watchdog" 规则的配置,请提供更多关于你使用的监控系统或工具的信息,以便我能够提供更准确的帮助。
<br>
可以先把全部PrometheusRule的导到一个文件里,
`k -n monitoring get PrometheusRule -o yaml > all.yaml`
然后
` cat all.yaml | grep -C 20 Watch `
发现是
*name: prometheus-kube-prometheus-general.rules*
`k -n monitoring get PrometheusRule prometheus-kube-prometheus-general.rules -o yaml`
```yaml
apiVersion: monitoring.coreos.com/v1
kind: PrometheusRule
metadata:
annotations:
meta.helm.sh/release-name: prometheus
meta.helm.sh/release-namespace: monitoring
prometheus-operator-validated: "true"
creationTimestamp: "2023-06-09T06:49:01Z"
generation: 2
labels:
app: kube-prometheus-stack
app.kubernetes.io/instance: prometheus
app.kubernetes.io/managed-by: Helm
app.kubernetes.io/part-of: kube-prometheus-stack
app.kubernetes.io/version: 46.8.0
chart: kube-prometheus-stack-46.8.0
heritage: Helm
release: prometheus
name: prometheus-kube-prometheus-general.rules
namespace: monitoring
resourceVersion: "9619465346"
uid: 5802912f-2787-4882-ab80-c8c70345e040
spec:
groups:
- name: general.rules
rules:
- alert: TargetDown
annotations:
description: '{{ printf "%.4g" $value }}% of the {{ $labels.job }}/{{ $labels.service
}} targets in {{ $labels.namespace }} namespace are down.'
runbook_url: https://runbooks.prometheus-operator.dev/runbooks/general/targetdown
summary: One or more targets are unreachable.
expr: 100 * (count(up == 0) BY (cluster, job, namespace, service) / count(up)
BY (cluster, job, namespace, service)) > 10
for: 10m
labels:
cluster: newtaskon
severity: warning
- alert: Watchdog
annotations:
description: |
This is an alert meant to ensure that the entire alerting pipeline is functional.
This alert is always firing, therefore it should always be firing in Alertmanager
and always fire against a receiver. There are integrations with various notification
mechanisms that send a notification when this alert is not firing. For example the
"DeadMansSnitch" integration in PagerDuty.
runbook_url: https://runbooks.prometheus-operator.dev/runbooks/general/watchdog
summary: An alert that should always be firing to certify that Alertmanager
is working properly.
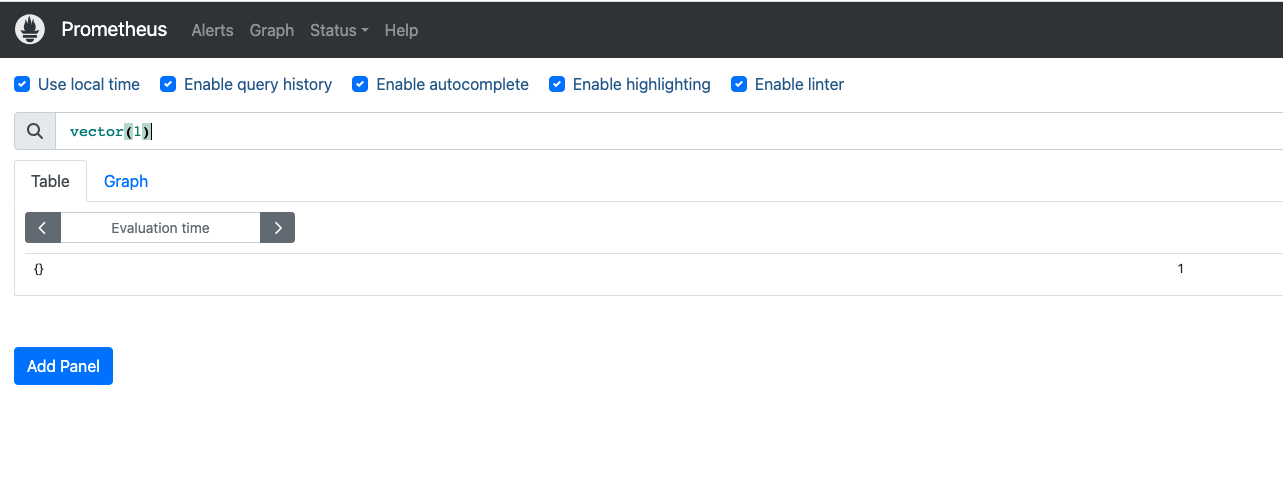
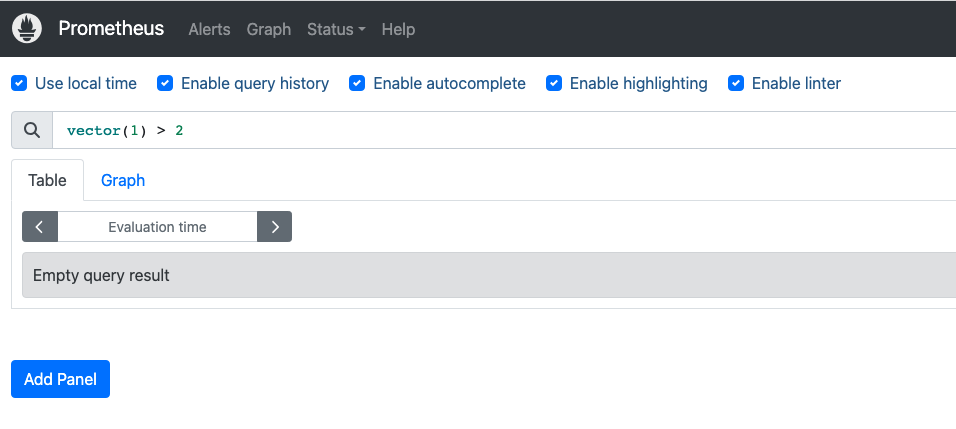
expr: vector(1)
labels:
severity: none
上面这段配置的意思是:
在上面的规则中,您提到了一个名为”Watchdog”的警报。这个警报旨在确保整个报警流程正常运行。该警报始终处于触发状态,因此它应该始终在Alertmanager中触发,并针对一个接收器触发。与各种通知机制集成,当此警报未触发时发送通知。例如,PagerDuty中的”DeadMansSnitch”集成。该警报表达式为vector(1),表示始终返回一个值。它的标签中没有设置严重性(severity)标签,因此可以认为它的严重性为”none”,即不具有严重性。
请注意,这些信息是基于您提供的Prometheus规则的配置。具体的标签和注释可能会因您的环境和配置而有所不同。
vector(1) 在普罗米修斯中什么意思?
在Prometheus中,vector(1) 表示一个包含单个样本的向量。向量是Prometheus中的一种数据类型,它表示在给定时间点上的样本集合。
在Prometheus中,监控指标是通过时间序列(time series)来表示的。时间序列是一系列具有相同指标名称和一组标签(labels)的样本,每个样本由一个时间戳和对应的数值组成。
vector(1) 表示只包含一个样本的向量,该样本的值为1。这意味着在给定时间点上,只有一个样本的值为1。这个向量可以在Prometheus的查询语言中使用,进行各种计算和聚合操作。
例如,可以将 vector(1) 与其他时间序列进行加法、减法、乘法或除法运算,以生成新的时间序列。它还可以与其他向量函数(例如 sum()、avg() 等)一起使用,进行更复杂的聚合操作。
需要注意的是,vector(1) 只是一个示例,实际使用中,向量可以包含多个样本,并具有不同的数值和时间戳,以表示更多的监控指标数据。
当前 问题在Resolved后,没有发送Resolved的消息。
对于二进制部署的方式,是在alertmanager的alertmanager.yml中,相应的告警下方添加
send_resolved: true
对于k8s方式部署的监控告警,如何设置呢?
在 Kubernetes 中使用 Prometheus Operator 或类似的工具部署的监控告警,可以通过 PrometheusRule 资源来设置 send_resolved 选项。send_resolved 用于指定在问题解决后是否发送 “Resolved” 的消息。
要设置 send_resolved 选项,可以在 PrometheusRule 的规则配置中添加一个附加的注释标签(annotation)。这个注释标签的键为 prometheus.io/alertmanager,值为一个包含 send_resolved: true 的 YAML 字符串。这样,当问题被解决后,Alertmanager 将会发送 “Resolved” 的消息。
以下是在 PrometheusRule 中设置 send_resolved 的示例:
1 | apiVersion: monitoring.coreos.com/v1 |
在上述示例中,annotations 部分包含了用于告警的注释标签。prometheus.io/alertmanager 标签的值是一个包含 send_resolved: true 的 JSON 字符串。这将告诉 Alertmanager 在问题解决后发送 “Resolved” 的消息。
请注意,具体的配置方式可能因使用的监控工具或配置方式而有所不同。上述示例是一种常见的设置方法,但在实际部署中可能需要根据具体情况进行调整。确保根据你的监控系统和部署方式参考相关文档进行正确的配置。
20250602
[FIRING:1] KubeletPlegDurationHigh (172.22.0.22:10250 172.22.0.22 monitoring/prometheus-kube-prometheus-prometheus 0.99 warning)
The Kubelet Pod Lifecycle Event Generator has a 99th percentile duration of 10 seconds on node 172.22.0.22. https://runbooks.prometheus-operator.dev/runbooks/kubernetes/kubeletplegdurationhigh Kubelet Pod Lifecycle Event Generator is taking too long to relist.
Alerts Firing:
Labels:
- alertname = KubeletPlegDurationHigh
- instance = 172.22.0.22:10250
- node = 172.22.0.22
- prometheus = monitoring/prometheus-kube-prometheus-prometheus
- quantile = 0.99
- severity = warning
Annotations: - description = The Kubelet Pod Lifecycle Event Generator has a 99th percentile duration of 10 seconds on node 172.22.0.22.
- runbook_url = https://runbooks.prometheus-operator.dev/runbooks/kubernetes/kubeletplegdurationhigh
- summary = Kubelet Pod Lifecycle Event Generator is taking too long to relist.
Source: http://prometheus-kube-prometheus-prometheus.monitoring:9090/graph?g0.expr=node_quantile%3Akubelet_pleg_relist_duration_seconds%3Ahistogram_quantile%7Bquantile%3D%220.99%22%7D+%3E%3D+10&g0.tab=1
AlertmanagerUrl:
http://prometheus-kube-prometheus-alertmanager.monitoring:9093/#/alerts?receiver=wechat
这个 KubeletPlegDurationHigh 告警表示 Kubernetes 节点上的 kubelet 组件出现了性能问题。让我为你详细解释:
问题分析
PLEG (Pod Lifecycle Event Generator) 是 kubelet 的一个重要组件,负责:
- 定期检查容器运行时状态
- 生成 Pod 生命周期事件
- 维护 Pod 状态的准确性
当前问题:
- 节点
172.22.0.22上的 PLEG 重新列举(relist)操作的 99% 分位数延迟达到了 10 秒 - 这远超过正常范围(通常应该在几百毫秒内)
可能原因
容器运行时响应慢
- Docker/containerd 性能问题
- 存储 I/O 瓶颈
节点资源不足
- CPU 使用率过高
- 内存压力
- 磁盘 I/O 饱和
Pod 数量过多
- 节点上运行的 Pod 数量超出合理范围
- 容器数量过多
网络问题
- 容器网络配置问题
- CNI 插件性能问题
排查步骤
- 检查节点资源使用情况
1 | kubectl top node 172.22.0.22 |
- 检查该节点上的 Pod 数量
1 | kubectl get pods --all-namespaces --field-selector spec.nodeName=172.22.0.22 |
- 检查 kubelet 日志
1 | journalctl -u kubelet -f |
- 检查容器运行时状态
1 | systemctl status docker # 或 containerd |
解决建议
优化资源配置
- 增加节点 CPU/内存资源
- 优化磁盘 I/O 性能
调整 kubelet 参数
- 增加
--pod-max-pids限制 - 调整
--serialize-image-pulls=false
- 增加
减少节点负载
- 迁移部分 Pod 到其他节点
- 清理不必要的容器和镜像
监控和调优
- 持续监控 PLEG 延迟
- 定期清理容器运行时缓存
这个问题如果不及时处理,可能导致 kubelet 无法及时响应 API Server 请求,影响 Pod 调度和状态更新。
ubuntu@VM-0-22-ubuntu:$ kubectl top node 172.22.0.22$ kubectl describe node 172.22.0.22
NAME CPU(cores) CPU% MEMORY(bytes) MEMORY%
172.22.0.22 242m 6% 1669Mi 30%
ubuntu@VM-0-22-ubuntu:
Name: 172.22.0.22
Roles:
Labels: beta.kubernetes.io/arch=amd64
beta.kubernetes.io/instance-type=SA2.LARGE8
beta.kubernetes.io/os=linux
cloud.tencent.com/node-instance-id=ins-nd41mwy2
failure-domain.beta.kubernetes.io/region=sg
failure-domain.beta.kubernetes.io/zone=900003
kubernetes.io/arch=amd64
kubernetes.io/hostname=172.22.0.22
kubernetes.io/os=linux
node.kubernetes.io/instance-type=SA2.LARGE8
topology.com.tencent.cloud.csi.cbs/zone=ap-singapore-3
topology.kubernetes.io/region=sg
topology.kubernetes.io/zone=900003
Annotations: csi.volume.kubernetes.io/nodeid: {“com.tencent.cloud.csi.cbs”:”ins-nd41mwy2”}
node.alpha.kubernetes.io/ttl: 0
volumes.kubernetes.io/controller-managed-attach-detach: true
CreationTimestamp: Mon, 05 Jun 2023 09:50:38 +0800
Taints:
Unschedulable: false
Lease:
HolderIdentity: 172.22.0.22
AcquireTime:
RenewTime: Mon, 02 Jun 2025 10:14:21 +0800
Conditions:
Type Status LastHeartbeatTime LastTransitionTime Reason Message
NetworkUnavailable False Mon, 05 Jun 2023 09:50:42 +0800 Mon, 05 Jun 2023 09:50:42 +0800 RouteCreated RouteController created a route
MemoryPressure False Mon, 02 Jun 2025 10:10:58 +0800 Wed, 16 Oct 2024 20:14:34 +0800 KubeletHasSufficientMemory kubelet has sufficient memory available
DiskPressure False Mon, 02 Jun 2025 10:10:58 +0800 Fri, 07 Jun 2024 03:11:17 +0800 KubeletHasNoDiskPressure kubelet has no disk pressure
PIDPressure False Mon, 02 Jun 2025 10:10:58 +0800 Mon, 06 May 2024 10:05:19 +0800 KubeletHasSufficientPID kubelet has sufficient PID available
Ready True Mon, 02 Jun 2025 10:10:58 +0800 Mon, 02 Jun 2025 10:05:57 +0800 KubeletReady kubelet is posting ready status. AppArmor enabled
Addresses:
InternalIP: 172.22.0.22
ExternalIP: 43.153.222.192
Hostname: 172.22.0.22
Capacity:
cpu: 4
ephemeral-storage: 103097996Ki
hugepages-1Gi: 0
hugepages-2Mi: 0
memory: 7623360Ki
pods: 253
Allocatable:
cpu: 3900m
ephemeral-storage: 95015112957
hugepages-1Gi: 0
hugepages-2Mi: 0
memory: 5633728Ki
pods: 253
System Info:
Machine ID: 19b5978403fd40eb888d2ffa4c968153
System UUID: 19b59784-03fd-40eb-888d-2ffa4c968153
Boot ID: 5c3e0572-36e9-48c3-93b8-8a94fa2c20f5
Kernel Version: 5.4.0-139-generic
OS Image: Ubuntu 20.04 LTS
Operating System: linux
Architecture: amd64
Container Runtime Version: docker://19.3.9-tke.1
Kubelet Version: v1.22.5-tke.16
Kube-Proxy Version: v1.22.5-tke.16
PodCIDR: 10.16.3.0/24
PodCIDRs: 10.16.3.0/24
ProviderID: qcloud:///900003/ins-nd41mwy2
Non-terminated Pods: (19 in total)
Namespace Name CPU Requests CPU Limits Memory Requests Memory Limits Age
ingress-nginx ingress-nginx-controller-8c675bd6c-vc787 100m (2%) 0 (0%) 90Mi (1%) 0 (0%) 243d
kube-system cls-provisioner-75df9b4649-hgfmb 100m (2%) 100m (2%) 64M (1%) 64M (1%) 353d
kube-system csi-cbs-node-5dssr 0 (0%) 0 (0%) 0 (0%) 0 (0%) 728d
kube-system ip-masq-agent-tpgqg 0 (0%) 0 (0%) 0 (0%) 0 (0%) 728d
kube-system kube-proxy-8c48l 0 (0%) 0 (0%) 0 (0%) 0 (0%) 728d
kube-system l7-lb-controller-7bffbb7f6f-5htzl 0 (0%) 0 (0%) 0 (0%) 0 (0%) 420d
kube-system tke-bridge-agent-wbk72 0 (0%) 0 (0%) 0 (0%) 0 (0%) 728d
kube-system tke-cni-agent-b9mlz 0 (0%) 0 (0%) 0 (0%) 0 (0%) 728d
kube-system tke-log-agent-gzbnd 210m (5%) 2100m (53%) 124M (2%) 1360M (23%) 723d
kube-system tke-monitor-agent-x5cfl 10m (0%) 100m (2%) 30Mi (0%) 100Mi (1%) 647d
monitoring prometheus-prometheus-node-exporter-42qg2 0 (0%) 0 (0%) 0 (0%) 0 (0%) 723d
taskon earn-taskon-xyz-68cfbc454-dbxj2 0 (0%) 0 (0%) 0 (0%) 0 (0%) 180d
taskon hello-app-rongyi-5669588578-rswv2 0 (0%) 0 (0%) 0 (0%) 0 (0%) 243d
taskon taskon-chain-5fbf895fcc-pwn98 0 (0%) 0 (0%) 0 (0%) 0 (0%) 24d
taskon taskon-feedback-7c644996d9-bn4tp 0 (0%) 0 (0%) 0 (0%) 0 (0%) 2d17h
taskon taskon-operation-bot-5fcb96785b-j9879 0 (0%) 0 (0%) 0 (0%) 0 (0%) 24d
taskon taskon-scanner-76c567f59c-bgzzt 0 (0%) 0 (0%) 0 (0%) 0 (0%) 17d
taskon www-taskon-xyz-7f64cb9f49-929c8 0 (0%) 0 (0%) 0 (0%) 0 (0%) 2d16h
taskon www-taskon-xyz-rongyi-test-6c6f7594b9-tgwmf 0 (0%) 0 (0%) 0 (0%) 0 (0%) 2d16h
Allocated resources:
(Total limits may be over 100 percent, i.e., overcommitted.)
Resource Requests Limits
cpu 420m (10%) 2300m (58%)
memory 313829120 (5%) 1528857600 (26%)
ephemeral-storage 0 (0%) 0 (0%)
hugepages-1Gi 0 (0%) 0 (0%)
hugepages-2Mi 0 (0%) 0 (0%)
Events:
Type Reason Age From Message
Warning SystemOOM 12m kubelet System OOM encountered, victim process: uvicorn, pid: 588292
Warning SystemOOM 11m kubelet System OOM encountered, victim process: python, pid: 588293
Normal NodeNotReady 11m (x6 over 77d) kubelet Node 172.22.0.22 status is now: NodeNotReady
Warning SystemOOM 10m kubelet System OOM encountered, victim process: taskon-scanner, pid: 588233
Warning SystemOOM 8m29s kubelet System OOM encountered, victim process: qcloud_ingress, pid: 1331737
Normal NodeReady 8m26s (x7 over 392d) kubelet Node 172.22.0.22 status is now: NodeReady
ubuntu@VM-0-22-ubuntu:~$
ubuntu@VM-0-22-ubuntu:$ kubectl get pods –all-namespaces –field-selector spec.nodeName=172.22.0.22$
NAMESPACE NAME READY STATUS RESTARTS AGE
ingress-nginx ingress-nginx-controller-8c675bd6c-vc787 1/1 Running 10 (10m ago) 243d
kube-system cls-provisioner-75df9b4649-hgfmb 1/1 Running 0 353d
kube-system csi-cbs-node-5dssr 2/2 Running 5 (392d ago) 728d
kube-system ip-masq-agent-tpgqg 1/1 Running 2 (392d ago) 728d
kube-system kube-proxy-8c48l 1/1 Running 2 (392d ago) 728d
kube-system l7-lb-controller-7bffbb7f6f-5htzl 1/1 Running 7 (10m ago) 420d
kube-system tke-bridge-agent-wbk72 1/1 Running 4 (392d ago) 728d
kube-system tke-cni-agent-b9mlz 1/1 Running 2 (392d ago) 728d
kube-system tke-log-agent-gzbnd 3/3 Running 17 (9m55s ago) 723d
kube-system tke-monitor-agent-x5cfl 1/1 Running 2 (392d ago) 647d
monitoring prometheus-prometheus-node-exporter-42qg2 1/1 Running 4 (392d ago) 723d
taskon earn-taskon-xyz-68cfbc454-dbxj2 1/1 Running 0 180d
taskon hello-app-rongyi-5669588578-rswv2 1/1 Running 0 243d
taskon taskon-chain-5fbf895fcc-pwn98 1/1 Running 2 (16d ago) 24d
taskon taskon-feedback-7c644996d9-bn4tp 1/1 Running 0 2d17h
taskon taskon-operation-bot-5fcb96785b-j9879 1/1 Running 4 (13m ago) 24d
taskon taskon-scanner-76c567f59c-bgzzt 1/1 Running 2 (12m ago) 17d
taskon www-taskon-xyz-7f64cb9f49-929c8 1/1 Running 0 2d16h
taskon www-taskon-xyz-rongyi-test-6c6f7594b9-tgwmf 1/1 Running 0 2d16h
ubuntu@VM-0-22-ubuntu:
ubuntu@VM-0-22-ubuntu:$$
ubuntu@VM-0-22-ubuntu:
ubuntu@VM-0-22-ubuntu:$$
ubuntu@VM-0-22-ubuntu:
ubuntu@VM-0-22-ubuntu:$$
ubuntu@VM-0-22-ubuntu:
ubuntu@VM-0-22-ubuntu:~$ journalctl -u kubelet -f
– Logs begin at Sun 2025-03-30 08:19:41 CST. –
Jun 02 10:17:28 VM-0-22-ubuntu kubelet[935]: E0602 10:17:28.086371 935 kubelet_volumes.go:245] “There were many similar errors. Turn up verbosity to see them.” err=”orphaned pod "5ae5c64c-a54e-42e5-9013-24ac93d4347a" found, but error not a directory occurred when trying to remove the volumes dir” numErrs=5
Jun 02 10:17:30 VM-0-22-ubuntu kubelet[935]: E0602 10:17:30.087557 935 kubelet_volumes.go:245] “There were many similar errors. Turn up verbosity to see them.” err=”orphaned pod "5ae5c64c-a54e-42e5-9013-24ac93d4347a" found, but error not a directory occurred when trying to remove the volumes dir” numErrs=5
Jun 02 10:17:32 VM-0-22-ubuntu kubelet[935]: E0602 10:17:32.080013 935 kubelet_volumes.go:245] “There were many similar errors. Turn up verbosity to see them.” err=”orphaned pod "5ae5c64c-a54e-42e5-9013-24ac93d4347a" found, but error not a directory occurred when trying to remove the volumes dir” numErrs=5
Jun 02 10:17:34 VM-0-22-ubuntu kubelet[935]: E0602 10:17:34.086785 935 kubelet_volumes.go:245] “There were many similar errors. Turn up verbosity to see them.” err=”orphaned pod "5ae5c64c-a54e-42e5-9013-24ac93d4347a" found, but error not a directory occurred when trying to remove the volumes dir” numErrs=5
Jun 02 10:17:36 VM-0-22-ubuntu kubelet[935]: E0602 10:17:36.087171 935 kubelet_volumes.go:245] “There were many similar errors. Turn up verbosity to see them.” err=”orphaned pod "5ae5c64c-a54e-42e5-9013-24ac93d4347a" found, but error not a directory occurred when trying to remove the volumes dir” numErrs=5
Jun 02 10:17:38 VM-0-22-ubuntu kubelet[935]: E0602 10:17:38.080112 935 kubelet_volumes.go:245] “There were many similar errors. Turn up verbosity to see them.” err=”orphaned pod "5ae5c64c-a54e-42e5-9013-24ac93d4347a" found, but error not a directory occurred when trying to remove the volumes dir” numErrs=5
Jun 02 10:17:40 VM-0-22-ubuntu kubelet[935]: E0602 10:17:40.103049 935 kubelet_volumes.go:245] “There were many similar errors. Turn up verbosity to see them.” err=”orphaned pod "5ae5c64c-a54e-42e5-9013-24ac93d4347a" found, but error not a directory occurred when trying to remove the volumes dir” numErrs=5
Jun 02 10:17:42 VM-0-22-ubuntu kubelet[935]: E0602 10:17:42.087084 935 kubelet_volumes.go:245] “There were many similar errors. Turn up verbosity to see them.” err=”orphaned pod "5ae5c64c-a54e-42e5-9013-24ac93d4347a" found, but error not a directory occurred when trying to remove the volumes dir” numErrs=5
Jun 02 10:17:44 VM-0-22-ubuntu kubelet[935]: E0602 10:17:44.084214 935 kubelet_volumes.go:245] “There were many similar errors. Turn up verbosity to see them.” err=”orphaned pod "5ae5c64c-a54e-42e5-9013-24ac93d4347a" found, but error not a directory occurred when trying to remove the volumes dir” numErrs=5
Jun 02 10:17:46 VM-0-22-ubuntu kubelet[935]: E0602 10:17:46.087193 935 kubelet_volumes.go:245] “There were many similar errors. Turn up verbosity to see them.” err=”orphaned pod "5ae5c64c-a54e-42e5-9013-24ac93d4347a" found, but error not a directory occurred when trying to remove the volumes dir” numErrs=5
Jun 02 10:17:48 VM-0-22-ubuntu kubelet[935]: E0602 10:17:48.087289 935 kubelet_volumes.go:245] “There were many similar errors. Turn up verbosity to see them.” err=”orphaned pod "5ae5c64c-a54e-42e5-9013-24ac93d4347a" found, but error not a directory occurred when trying to remove the volumes dir” numErrs=5
Jun 02 10:17:50 VM-0-22-ubuntu kubelet[935]: E0602 10:17:50.080236 935 kubelet_volumes.go:245] “There were many similar errors. Turn up verbosity to see them.” err=”orphaned pod "5ae5c64c-a54e-42e5-9013-24ac93d4347a" found, but error not a directory occurred when trying to remove the volumes dir” numErrs=5
Jun 02 10:17:52 VM-0-22-ubuntu kubelet[935]: E0602 10:17:52.088166 935 kubelet_volumes.go:245] “There were many similar errors. Turn up verbosity to see them.” err=”orphaned pod "5ae5c64c-a54e-42e5-9013-24ac93d4347a" found, but error not a directory occurred when trying to remove the volumes dir” numErrs=5
Jun 02 10:17:54 VM-0-22-ubuntu kubelet[935]: E0602 10:17:54.086533 935 kubelet_volumes.go:245] “There were many similar errors. Turn up verbosity to see them.” err=”orphaned pod "5ae5c64c-a54e-42e5-9013-24ac93d4347a" found, but error not a directory occurred when trying to remove the volumes dir” numErrs=5
Jun 02 10:17:56 VM-0-22-ubuntu kubelet[935]: E0602 10:17:56.079277 935 kubelet_volumes.go:245] “There were many similar errors. Turn up verbosity to see them.” err=”orphaned pod "5ae5c64c-a54e-42e5-9013-24ac93d4347a" found, but error not a directory occurred when trying to remove the volumes dir” numErrs=5
Jun 02 10:17:58 VM-0-22-ubuntu kubelet[935]: E0602 10:17:58.103583 935 kubelet_volumes.go:245] “There were many similar errors. Turn up verbosity to see them.” err=”orphaned pod "5ae5c64c-a54e-42e5-9013-24ac93d4347a" found, but error not a directory occurred when trying to remove the volumes dir” numErrs=5
Jun 02 10:18:00 VM-0-22-ubuntu kubelet[935]: E0602 10:18:00.079025 935 kubelet_volumes.go:245] “There were many similar errors. Turn up verbosity to see them.” err=”orphaned pod "5ae5c64c-a54e-42e5-9013-24ac93d4347a" found, but error not a directory occurred when trying to remove the volumes dir” numErrs=5
Jun 02 10:18:02 VM-0-22-ubuntu kubelet[935]: E0602 10:18:02.085925 935 kubelet_volumes.go:245] “There were many similar errors. Turn up verbosity to see them.” err=”orphaned pod "5ae5c64c-a54e-42e5-9013-24ac93d4347a" found, but error not a directory occurred when trying to remove the volumes dir” numErrs=5
Jun 02 10:18:04 VM-0-22-ubuntu kubelet[935]: E0602 10:18:04.094224 935 kubelet_volumes.go:245] “There were many similar errors. Turn up verbosity to see them.” err=”orphaned pod "5ae5c64c-a54e-42e5-9013-24ac93d4347a" found, but error not a directory occurred when trying to remove the volumes dir” numErrs=5
^C
ubuntu@VM-0-22-ubuntu:$$ systemctl status docker
ubuntu@VM-0-22-ubuntu:
Unit docker.service could not be found.
你说得对,从监控数据看 CPU 使用率确实不高(只有 6%),但是我发现了问题的根本原因:
关键问题:频繁的系统 OOM(内存溢出)
从 kubectl describe node 的 Events 部分可以看到:
1 | Warning SystemOOM 12m kubelet System OOM encountered, victim process: uvicorn, pid: 588292 |
这是导致 PLEG 延迟高的真正原因!
问题分析
系统内存压力:
- 节点总内存:7.6GB,可分配:5.6GB
- 当前内存使用:1669Mi (30%)
- 但频繁发生 OOM,说明实际内存使用接近极限
OOM 对 PLEG 的影响:
- 系统 OOM 时,内核会暂停所有进程进行内存回收
- kubelet 的 PLEG 操作被阻塞,导致 relist 延迟飙升
- 进程被杀死后重启,进一步增加系统负载
内存分配问题:
- 很多 Pod 没有设置内存 limits(显示为 0)
- 这可能导致某些容器消耗过多内存
解决方案
1. 立即处理
1 | # 检查哪些进程占用内存最多 |
2. 设置资源限制
为没有设置 memory limits 的 Pod 添加资源限制,特别是:
taskon命名空间下的应用earn-taskon-xyz、taskon-scanner等
3. 监控和优化
1 | # 检查具体的内存使用情况 |
4. 长期解决
- 增加节点内存或添加新节点
- 为所有应用设置合理的资源请求和限制
- 考虑启用内存交换(如果可行)
总结:PLEG 延迟高不是因为 CPU 问题,而是因为频繁的系统 OOM 导致 kubelet 操作被阻塞。需要重点解决内存管理问题。
如何查看有没有触发kubectl cordon
可以通过以下几种方法查看节点是否被 kubectl cordon 标记为不可调度:
1. 查看节点调度状态
1 | # 查看所有节点的调度状态 |
从你之前提供的输出中,我已经可以看到:
1 | Unschedulable: false |
这表明节点 没有被 cordon,仍然可以调度新的 Pod。
2. 检查节点 Taints
1 | # 查看节点的 taints 信息 |
从你的输出中可以看到:
1 | Taints: <none> |
说明节点没有任何 taints。
3. 检查节点标签和注解
1 | # 查看是否有相关的调度标签 |
4. 查看 kubectl cordon 相关的状态指标
当节点被 cordon 时,你会看到:
Unschedulable: true- 节点状态显示为
Ready,SchedulingDisabled - 可能会有相关的 taint:
node.kubernetes.io/unschedulable:NoSchedule
5. 实际验证方法
1 | # 如果想测试节点是否能正常调度,可以创建一个测试 Pod |
结论
根据你提供的节点信息:
Unschedulable: false- 节点可以调度Taints: <none>- 没有阻止调度的 taints- 节点状态为
Ready- 节点正常
该节点没有被 cordon,可以正常调度新的 Pod。
如果你怀疑调度有问题,可能需要检查:
- 是否有其他调度约束(如 nodeSelector、affinity 等)
- 资源是否充足(虽然从数据看资源使用不高)
- 是否有其他集群级别的调度策略
检查 label 调度错开 啥意思
“检查 label 调度错开” 指的是使用 Kubernetes 的标签选择器和调度策略来避免某些 Pod 被调度到特定节点,或者将不同类型的工作负载分散到不同的节点上。
主要概念和用途
1. 节点标签 (Node Labels)
1 | # 查看节点的所有标签 |
2. 调度错开的几种方式
A. 使用 nodeSelector 指定调度
1 | apiVersion: v1 |
B. 使用 nodeAffinity 更灵活的调度
1 | spec: |
C. 使用 podAntiAffinity 分散 Pod
1 | spec: |
3. 实际检查方法
1 | # 1. 查看节点标签 |
4. 常见的调度错开场景
A. 环境隔离
1 | # 给节点打标签区分环境 |
B. 工作负载类型隔离
1 | # 区分计算密集型和 IO 密集型节点 |
C. 高可用性分散
1 | # 确保同一应用的多个副本分散在不同节点 |
5. 检查当前集群的调度策略
1 | # 查看集群中所有 Pod 的调度分布 |
根据你的节点情况,如果要实现调度错开,可能的原因包括:
- 某些应用配置了避开这个节点的调度策略
- 基于资源使用情况的智能调度
- 基于节点标签的环境隔离策略
需要具体查看 Pod 的调度配置才能确定是否有相关的调度约束。
https://kubernetes.io/zh-cn/docs/reference/kubectl/generated/kubectl_cordon/
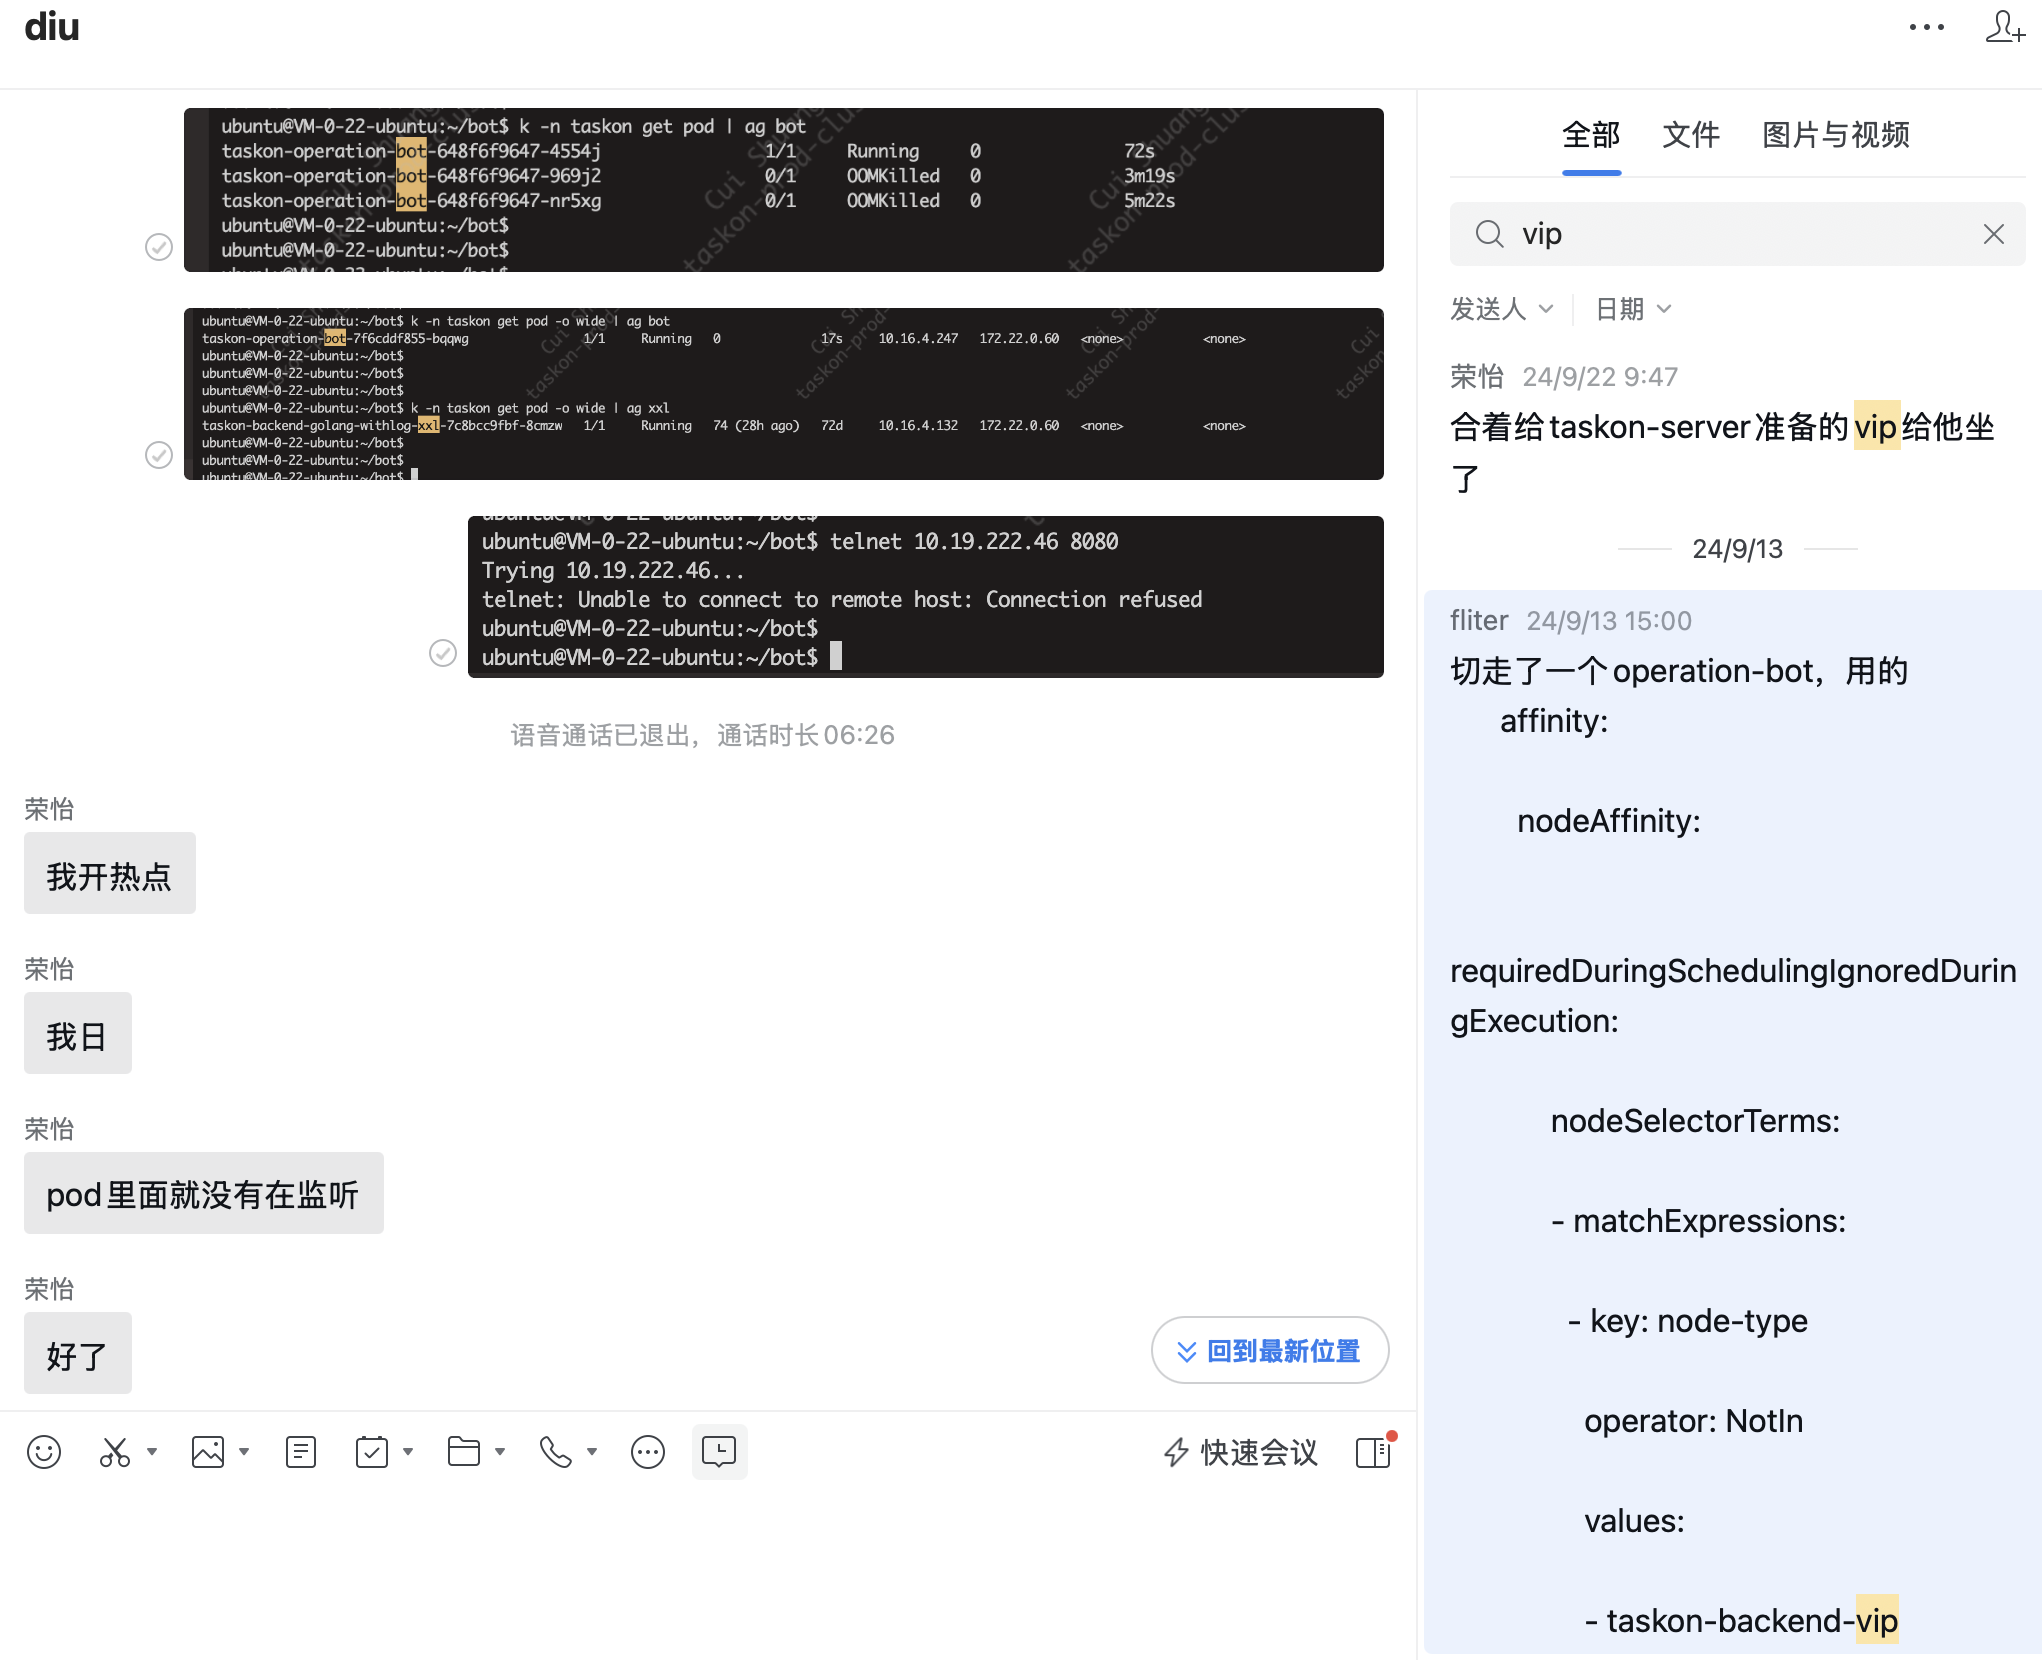
去年就是加了个label,让vip只能taskon-server优先用,结果…
查看taskon-reward-5f9bf4757b-7q5j7这个pod占用的内存
可以通过以下几种方法查看 taskon-reward-5f9bf4757b-7q5j7 这个 Pod 的内存占用:
1. 直接查看 Pod 资源使用情况
1 | # 查看单个 Pod 的资源使用 |
2. 查看 Pod 的详细信息
1 | # 查看 Pod 的详细描述,包括资源请求和限制 |
3. 查看 Pod 的资源配置
1 | # 专门查看资源部分 |
4. 如果 Pod 在运行,直接进入容器查看
1 | # 进入容器查看系统资源使用 |
5. 查看所有 taskon 命名空间的 Pod 内存使用
1 | # 查看 taskon 命名空间所有 Pod 的资源使用,按内存排序 |
6. 查看历史资源使用(如果有监控)
1 | # 如果集群有 Prometheus/Grafana,可以查看历史数据 |
预期输出示例
正常情况下,kubectl top pod 的输出类似:
1 | NAME CPU(cores) MEMORY(bytes) |
如果这个 Pod 是导致 OOM 的原因,你可能会看到:
- 内存使用很高(接近或超过限制)
- 在
kubectl describe pod的 Events 中看到 OOM 相关的警告 - Pod 可能处于
CrashLoopBackOff状态
请先运行 kubectl top pod taskon-reward-5f9bf4757b-7q5j7 -n taskon 查看当前的内存使用情况,然后我们可以进一步分析是否这个 Pod 与之前看到的 OOM 问题相关。
这条命令好啊~
查看 taskon 命名空间所有 Pod 的资源使用,按内存排序
kubectl top pods -n taskon –sort-by=memory
1 |
|
action看起来很吃cpu
从grafana趋势看,reward和server还是有潜在内存泄露
ubuntu@VM-0-22-ubuntu:$ k -n monitoring get PrometheusRule$
NAME AGE
mysql-connection-rules 723d
prometheus-kube-prometheus-alertmanager.rules 723d
prometheus-kube-prometheus-config-reloaders 723d
prometheus-kube-prometheus-etcd 723d
prometheus-kube-prometheus-general.rules 723d
prometheus-kube-prometheus-k8s.rules 723d
prometheus-kube-prometheus-kube-apiserver-availability.rules 723d
prometheus-kube-prometheus-kube-apiserver-burnrate.rules 723d
prometheus-kube-prometheus-kube-apiserver-histogram.rules 723d
prometheus-kube-prometheus-kube-apiserver-slos 723d
prometheus-kube-prometheus-kube-prometheus-general.rules 723d
prometheus-kube-prometheus-kube-prometheus-node-recording.rules 723d
prometheus-kube-prometheus-kube-state-metrics 723d
prometheus-kube-prometheus-kubelet.rules 723d
prometheus-kube-prometheus-kubernetes-apps 723d
prometheus-kube-prometheus-kubernetes-resources 723d
prometheus-kube-prometheus-kubernetes-storage 723d
prometheus-kube-prometheus-kubernetes-system 723d
prometheus-kube-prometheus-kubernetes-system-apiserver 723d
prometheus-kube-prometheus-kubernetes-system-kubelet 723d
prometheus-kube-prometheus-node-exporter 723d
prometheus-kube-prometheus-node-exporter.rules 723d
prometheus-kube-prometheus-node-network 723d
prometheus-kube-prometheus-node.rules 723d
prometheus-kube-prometheus-prometheus 723d
prometheus-kube-prometheus-prometheus-operator 723d
redis-rules 640d
taskon-decreasing-request 157d
twitter-validator-rule 723d
ubuntu@VM-0-22-ubuntu:
原文链接: https://dashen.tech/2020/10/09/K8s环境下普罗米修斯的规则配置/
版权声明: 转载请注明出处.