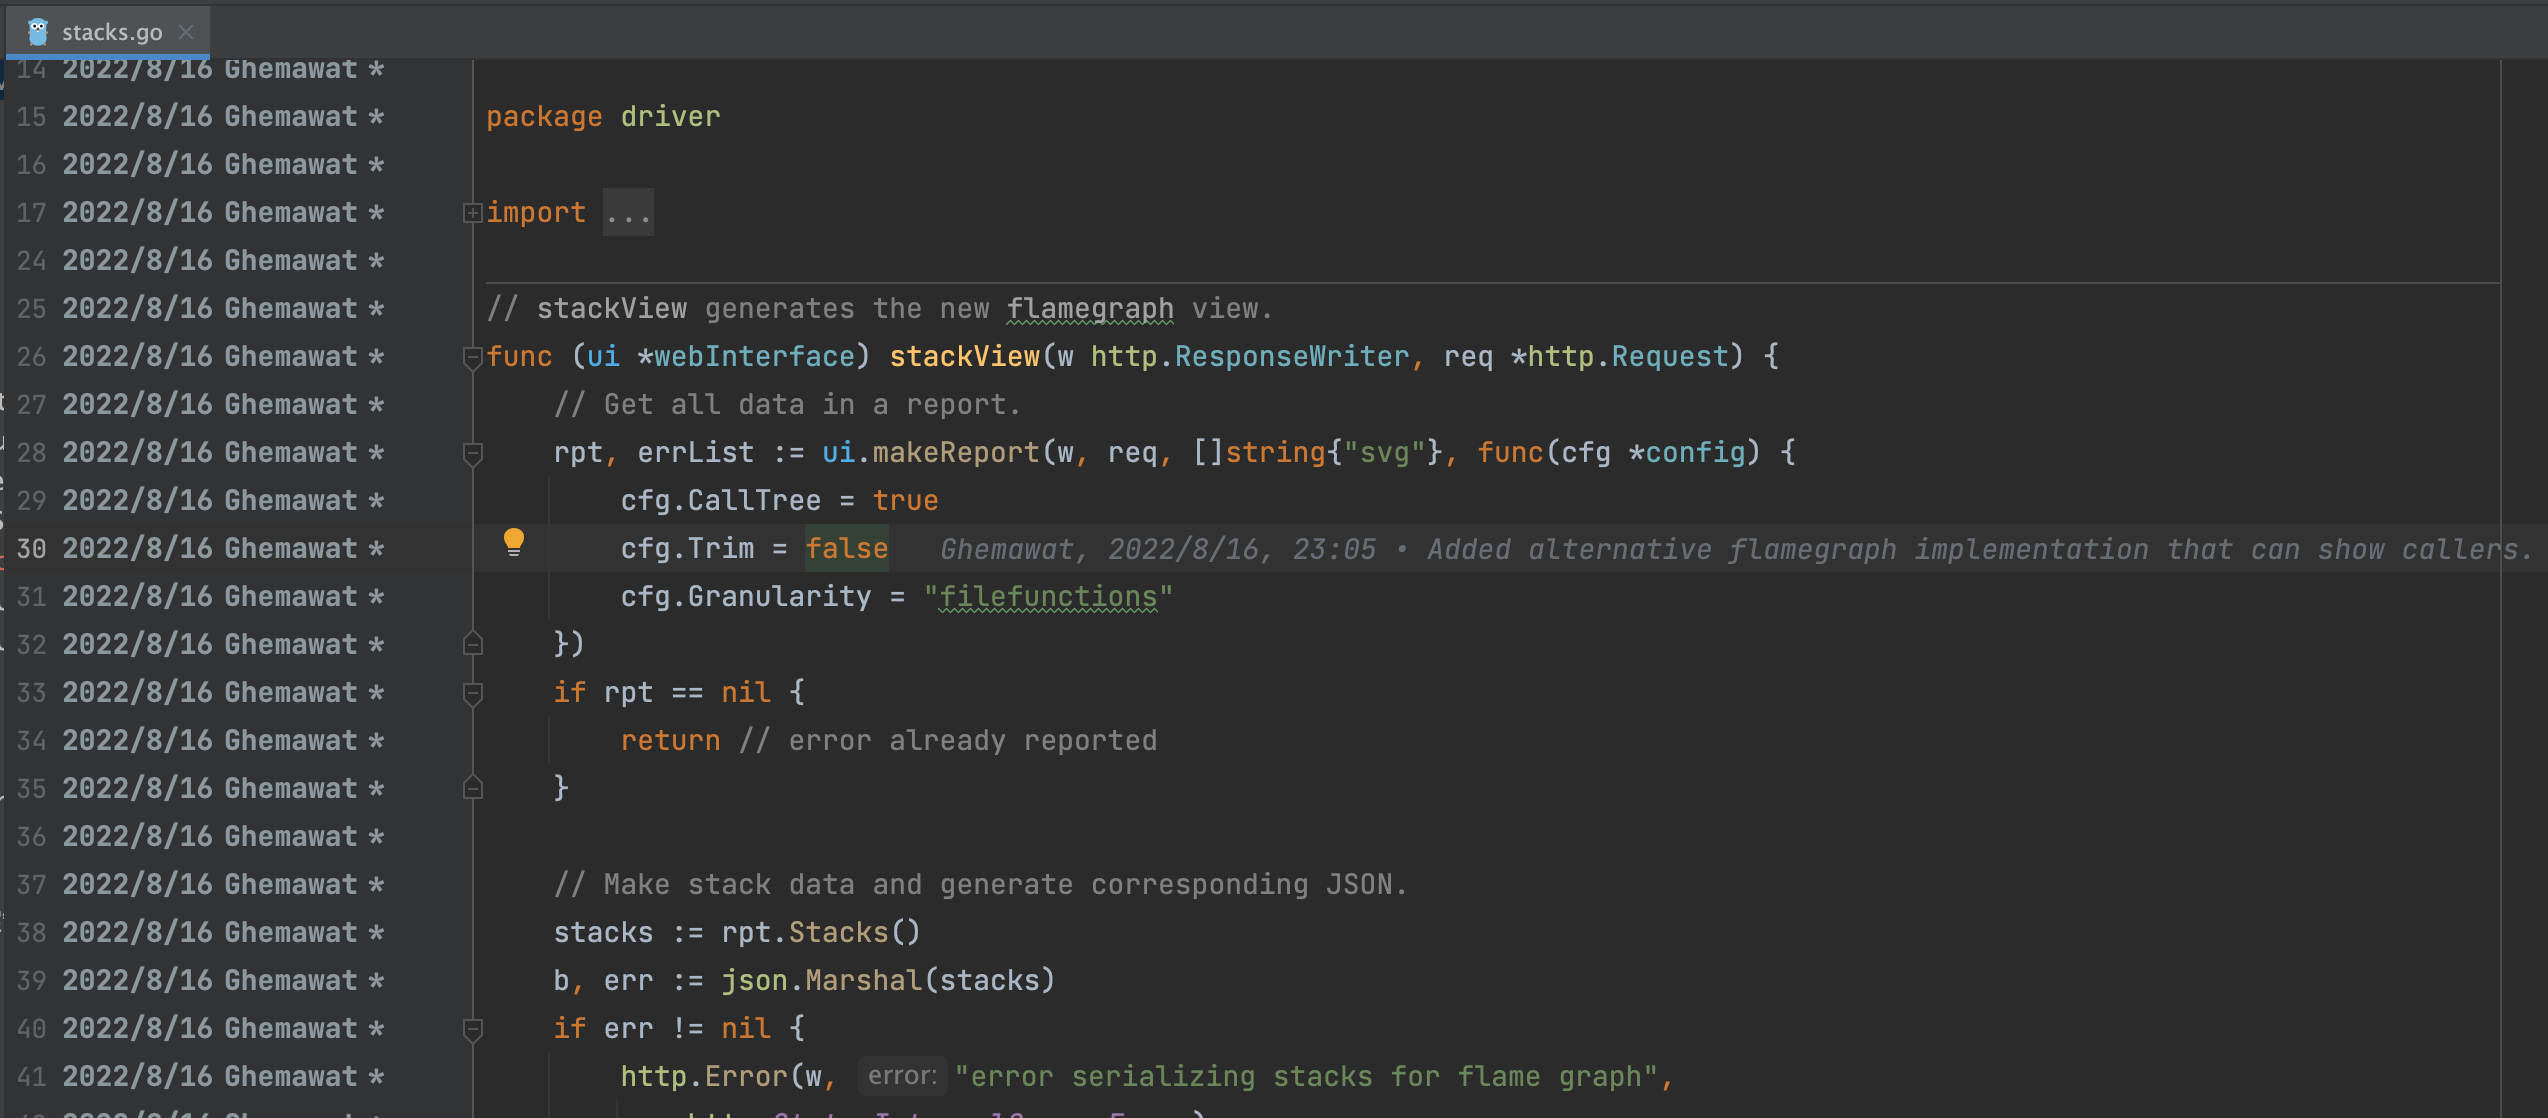
Added alternative flamegraph implementation that can show callers. (#716)
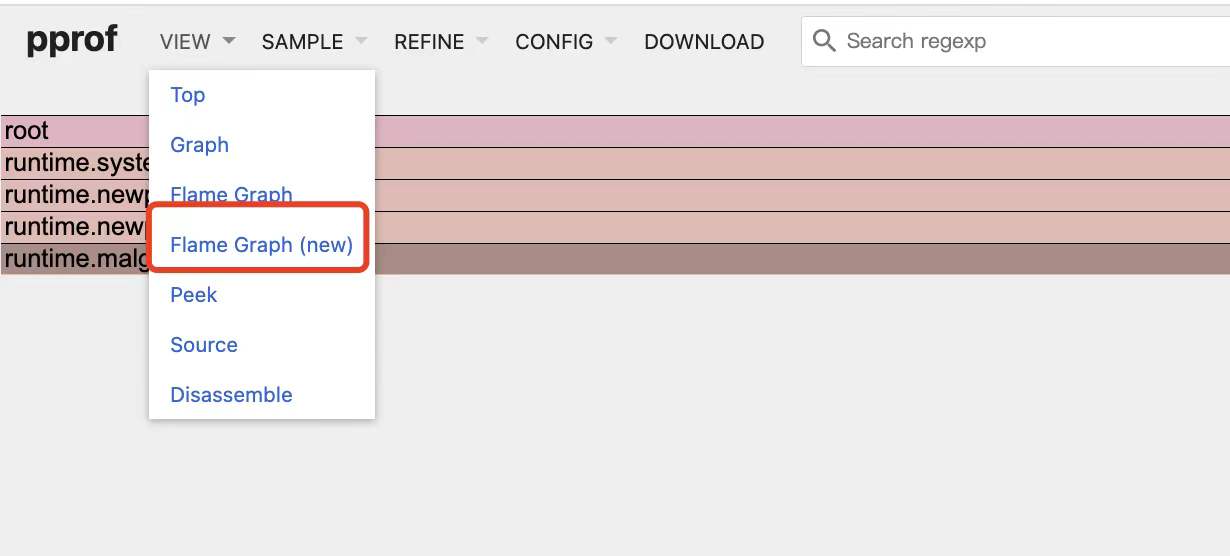
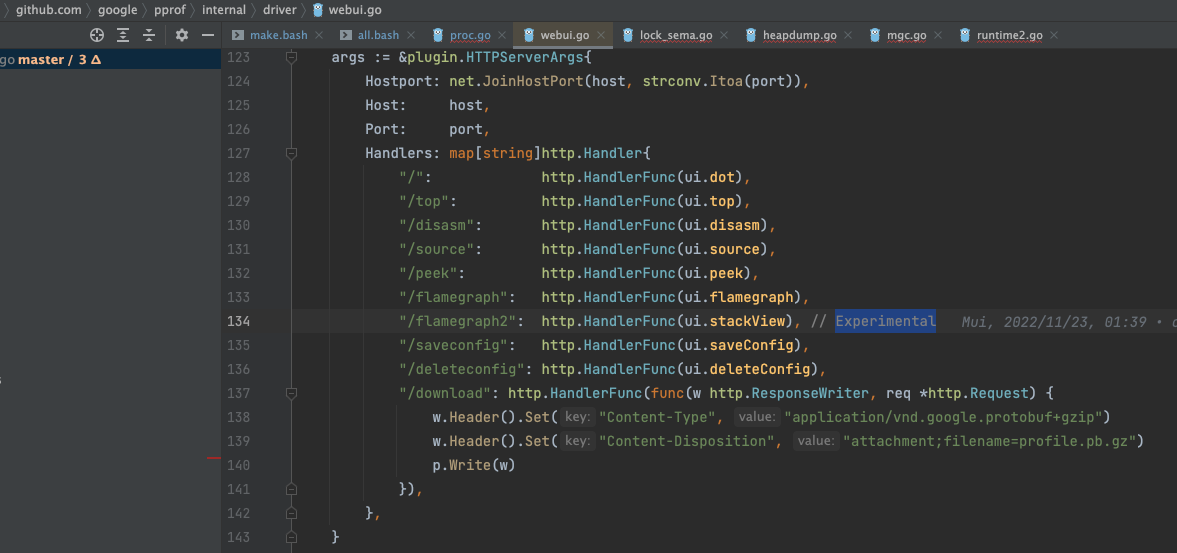
Add an experimental flame-graph implementation. It can be selected in pprof's web interface using the new "Flame (experimental)" menu entry. At some point this new implementation may become the default.
The new view is similar to flame-graph view. But it can show caller information as well. This should allow it to satisfy many users of Graph and Peek views as well.
Let's illustrate with an example. Suppose we have profile data that consists of the following stacks:
1000 main -> foo -> malloc 2000 main -> bar -> malloc
1
2
3
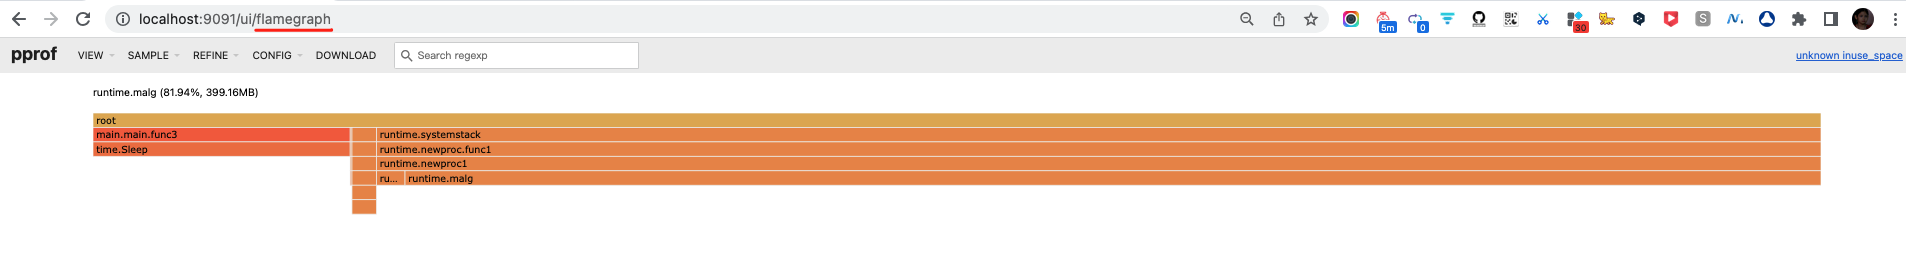
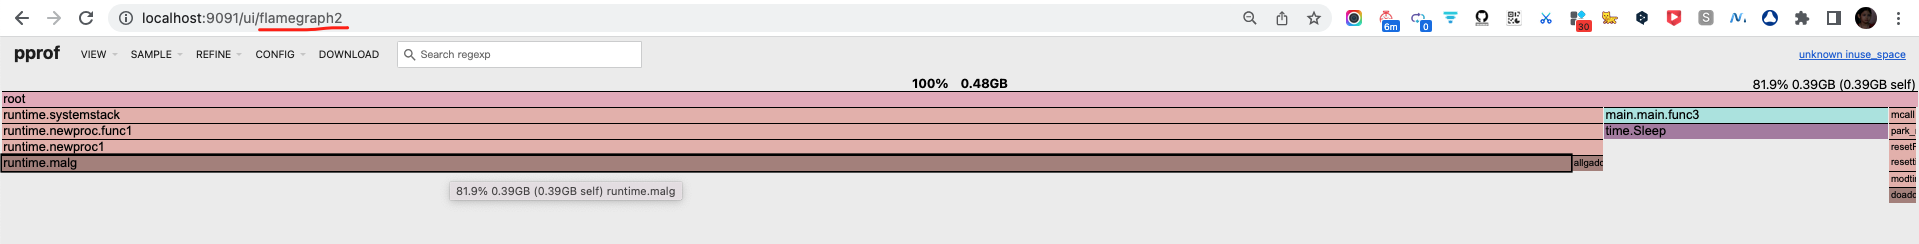
When main is selected, both the old and new views show:
This caller display is useful when trying to determine expensive
callers of function.

A list of important differences between the new view and flame graphs:

New view pros:

1.  Callers are shown, e.g., all paths leading to malloc.
2.  Shows self-cost clearly with a different saturation.
3.  Font size is adjusted to fit more text into boxes.
4.  Highlighting on hover shows other occurrences of a function.
5.  Search works more like other views.
6.  Pivot changes are reflected in browser history (so back and forward
    buttons can be used to navigate between different selections).
7.  Allows eventual removal of the D3 dependency, which may make
    integrations into various environments easier.
8.  Colors provide higher contrast between foreground and background.

New view cons:

1.  There are small differences in how things look and feel.
2.  Color-scheme is very different.
3.  Change triggered by selecting a new entry is not animated.