Kubernetes和微服务监控体系
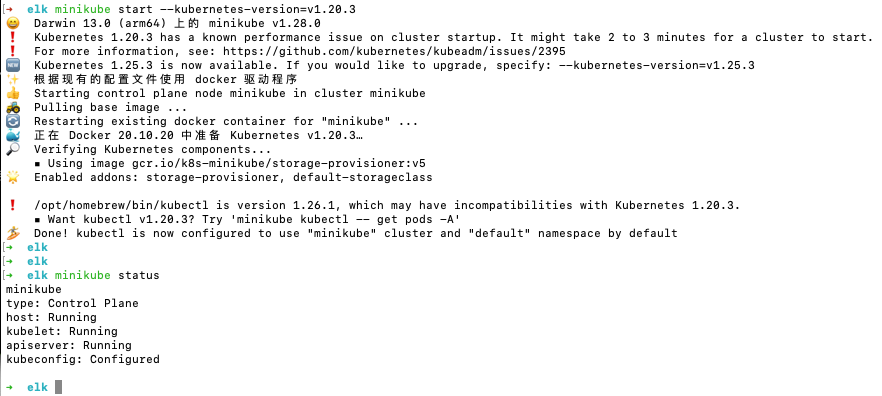
MiniKube EFK日志监控平台
EFK日志监控平台搭建
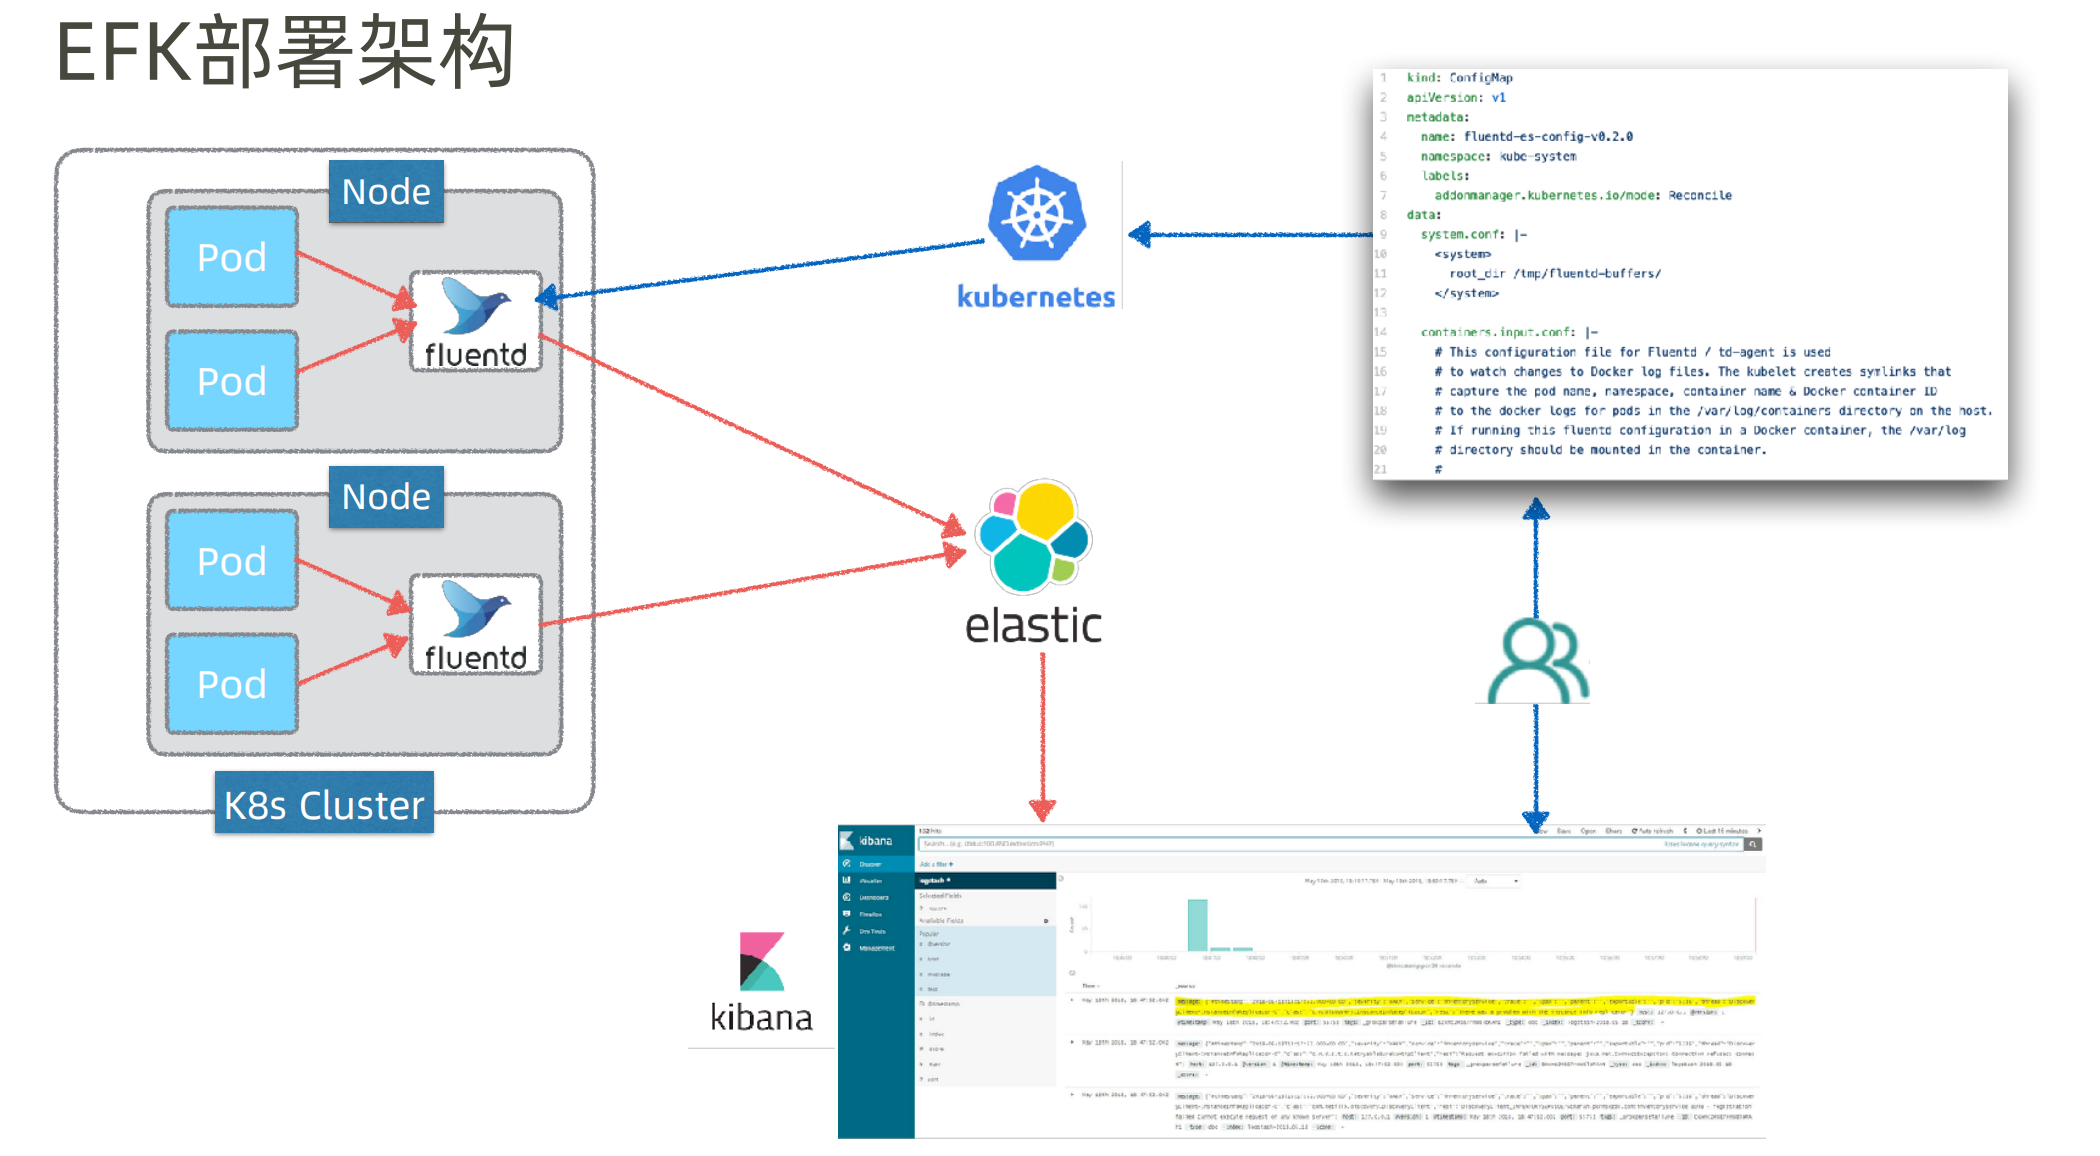
另外还有ELK,即用logstash来替代github.com/fluent/fluentd 来做 日志的收集、过滤和转换
logstash也是elastic的,Java写的
即ELK三个组件,都是用Java写的,都属于elastic
elk在K8s中其实支持add-on,但还是用发布文件的形式来发布。演示一下 DeamonSet
相关yaml文件在 https://github.com/spring2go/k8s-msa-in-action/tree/master/ch08/03
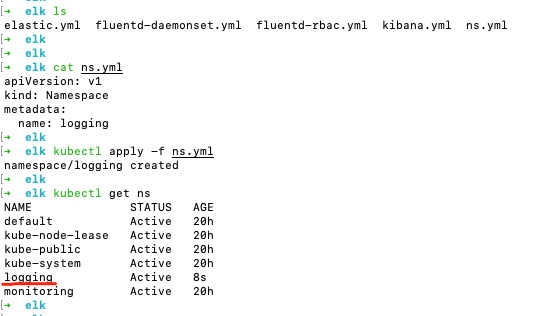
发布logging名字空间
都有yaml发布,不用命令行
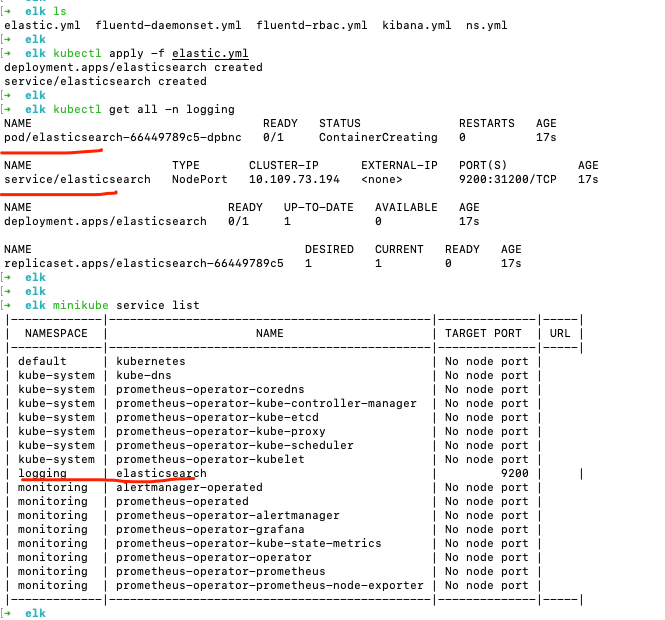
发布ElasticSearch
cat elastic.yml
1
2
3
4
5
6
7
8
9
10
11
12
13
14
15
16
17
18
19
20
21
22
23
24
25
26
27
28
29
30
31
32
33
34
35
36
37
38
39
40
41
42
43
44
45
46
47
| apiVersion: apps/v1
kind: Deployment
metadata:
name: elasticsearch
namespace: logging
spec:
selector:
matchLabels:
component: elasticsearch
template:
metadata:
labels:
component: elasticsearch
spec:
containers:
- name: elasticsearch
image: elasticsearch:7.17.0
env:
- name: discovery.type
value: single-node
ports:
- containerPort: 9200
name: http
protocol: TCP
resources:
limits:
cpu: 500m
memory: 1Gi
requests:
cpu: 500m
memory: 1Gi
---
apiVersion: v1
kind: Service
metadata:
name: elasticsearch
namespace: logging
labels:
service: elasticsearch
spec:
type: NodePort
selector:
component: elasticsearch
ports:
- port: 9200
targetPort: 9200
nodePort: 31200
|
kubectl describe po elasticsearch-66449789c5-dpbnc -n logging
1
2
3
4
5
6
7
8
9
10
11
12
13
14
15
16
17
18
19
20
21
22
23
24
25
26
27
28
29
30
31
32
33
34
35
36
37
38
39
40
41
42
43
44
45
46
47
48
49
50
51
52
53
54
55
56
57
58
| Name: elasticsearch-66449789c5-dpbnc
Namespace: logging
Priority: 0
Service Account: default
Node: minikube/192.168.49.2
Start Time: Fri, 30 Jun 2023 11:23:05 +0800
Labels: component=elasticsearch
pod-template-hash=66449789c5
Annotations: <none>
Status: Running
IP: 172.17.0.8
IPs:
IP: 172.17.0.8
Controlled By: ReplicaSet/elasticsearch-66449789c5
Containers:
elasticsearch:
Container ID: docker://67f673c6246f1db333936baca312e57bb4979b81696d51cd9a90acc299dac667
Image: docker.elastic.co/elasticsearch/elasticsearch:6.5.4
Image ID: docker-pullable://docker.elastic.co/elasticsearch/elasticsearch@sha256:5ca85697b6273f63196b44c32311c5a2d1135af9cfd919e5922e49c5045d04b8
Port: 9200/TCP
Host Port: 0/TCP
State: Running
Started: Fri, 30 Jun 2023 11:25:48 +0800
Ready: True
Restart Count: 0
Limits:
cpu: 500m
memory: 2Gi
Requests:
cpu: 500m
memory: 2Gi
Environment:
discovery.type: single-node
Mounts:
/var/run/secrets/kubernetes.io/serviceaccount from default-token-f4j2b (ro)
Conditions:
Type Status
Initialized True
Ready True
ContainersReady True
PodScheduled True
Volumes:
default-token-f4j2b:
Type: Secret (a volume populated by a Secret)
SecretName: default-token-f4j2b
Optional: false
QoS Class: Guaranteed
Node-Selectors: <none>
Tolerations: node.kubernetes.io/not-ready:NoExecute op=Exists for 300s
node.kubernetes.io/unreachable:NoExecute op=Exists for 300s
Events:
Type Reason Age From Message
---- ------ ---- ---- -------
Normal Scheduled 3m21s default-scheduler Successfully assigned logging/elasticsearch-66449789c5-dpbnc to minikube
Normal Pulling 3m20s kubelet Pulling image "docker.elastic.co/elasticsearch/elasticsearch:6.5.4"
Normal Pulled 40s kubelet Successfully pulled image "docker.elastic.co/elasticsearch/elasticsearch:6.5.4" in 2m40.551786157s
Normal Created 39s kubelet Created container elasticsearch
Normal Started 39s kubelet Started container elasticsearch
|
要等一会儿,pod才能创建成功
校验ElasticSearch
minikube ip
得到 192.168.49.2
但是访问 http://192.168.49.2:31200/ 不能通…
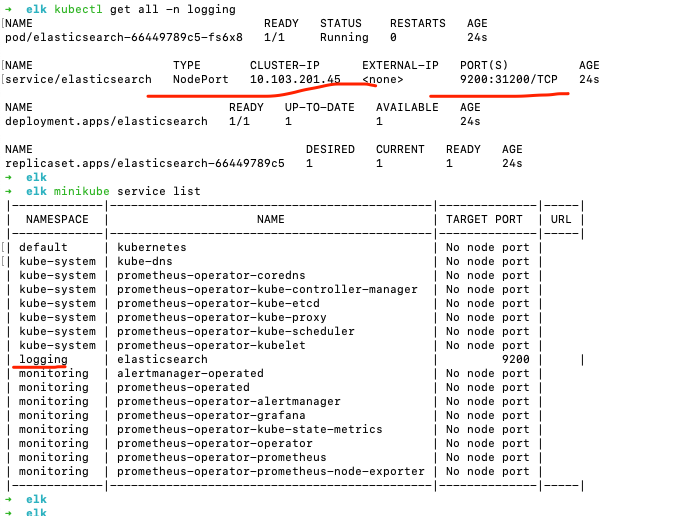
NAME TYPE CLUSTER-IP EXTERNAL-IP PORT(S) AGE
service/elasticsearch NodePort 10.109.73.194 9200:31200/TCP 24m
什么意思?
这是一个 Kubernetes 中的服务描述信息。让我为你解释每一部分的含义:
NAME: 表示服务的名称,这里是 elasticsearch。TYPE: 表示服务的类型,这里是 NodePort。NodePort 是一种将服务暴露给集群外部的方式,它会在每个节点上监听一个固定的端口,将流量转发到服务中。CLUSTER-IP: 表示服务的集群内部 IP 地址,这里是 10.109.73.194。这个 IP 地址用于在 Kubernetes 集群内部进行服务间的通信。EXTERNAL-IP: 表示服务的外部 IP 地址,这里是 <none>。由于 NodePort 类型的服务是通过节点的 IP 地址来访问的,所以它没有单独的外部 IP 地址。PORT(S): 表示服务的端口映射关系,这里是 9200:31200/TCP。它表示将服务的端口 9200 映射到节点上的端口 31200,这样外部的请求可以通过节点的 IP 地址和端口 31200 访问到服务。AGE: 表示服务的创建时间,这里是 24m,表示服务已经存在了 24 分钟。
综上所述,这个服务的名称是 elasticsearch,它是一个 NodePort 类型的服务,使用端口映射将服务的端口 9200 映射到节点上的端口 31200。该服务的集群内部 IP 地址为 10.109.73.194,没有单独的外部 IP 地址。该服务创建于 24 分钟之前。
我如何在外部访问这个服务
要在外部访问这个服务,你可以使用节点的 IP 地址和映射的端口来进行访问。根据之前提供的信息,该服务的端口映射关系是 9200:31200/TCP,意味着你可以通过节点的 IP 地址和端口 31200 来访问服务。
假设你的 Kubernetes 集群中有一个节点的 IP 地址为 192.168.1.100,那么你可以使用以下地址访问该服务:
1
| http://192.168.1.100:31200
|
请确保你的网络环境中允许从外部访问节点的 IP 地址和相应的端口。
我用的是minikube,如何查看集群中节点的 IP 地址
在 Minikube 中,你可以使用以下命令来查看集群中节点的 IP 地址:
运行该命令后,你将看到 Minikube 集群的 IP 地址。这个 IP 地址是你在本地机器上访问 Minikube 集群的入口点。将该 IP 地址与服务的端口映射(例如 31200)结合起来,你就可以从本地机器访问 Minikube 集群中的服务了。
请注意,这个 IP 地址仅在你启动 Minikube 并且集群正常运行时才可用。如果你停止或重新启动了 Minikube,IP 地址可能会改变。因此,在每次重新启动 Minikube 后,都要再次运行 minikube ip 命令来获取正确的 IP 地址。
应该是minikube要做什么设置… mac电脑下无法访问minikube的NodePort端口
先不用NodePort方式,使用port-forward,执行
kubectl port-forward -n logging elasticsearch-78947c76d9-n9hch 9200 (为验证是不是操作问题,delete了ns,重新apply了一下,pod名称可能和前面的对不上)
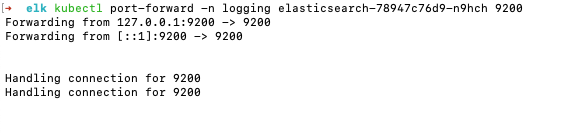
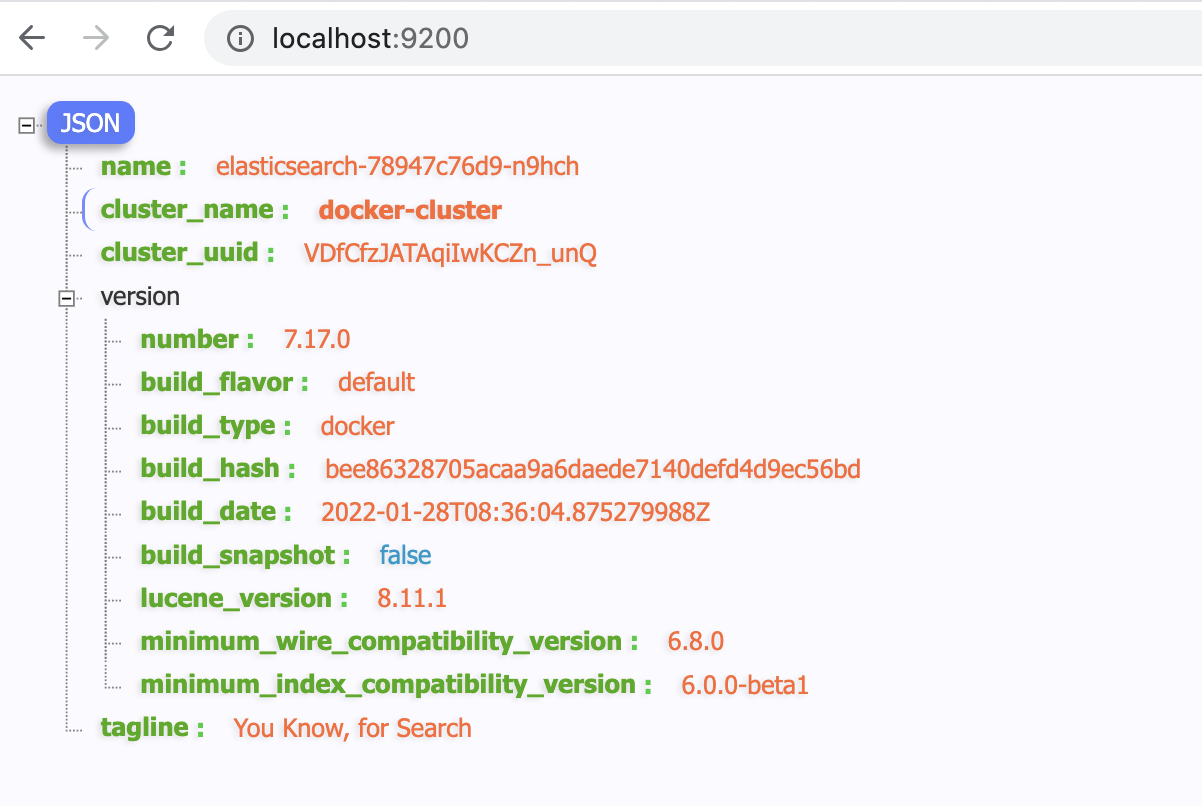
请求 http://localhost:9200/
发布Kibana
1
2
3
4
5
6
7
8
9
10
11
12
13
14
15
16
17
18
19
20
21
22
23
24
25
26
27
28
29
30
31
32
33
34
35
36
37
38
39
40
41
42
| apiVersion: apps/v1
kind: Deployment
metadata:
name: kibana
namespace: logging
spec:
selector:
matchLabels:
run: kibana
template:
metadata:
labels:
run: kibana
spec:
containers:
- name: kibana
image: docker.elastic.co/kibana/kibana:6.5.4
env:
- name: ELASTICSEARCH_URL
value: http://elasticsearch:9200
- name: XPACK_SECURITY_ENABLED
value: "true"
ports:
- containerPort: 5601
name: http
protocol: TCP
---
apiVersion: v1
kind: Service
metadata:
name: kibana
namespace: logging
labels:
service: kibana
spec:
type: NodePort
selector:
run: kibana
ports:
- port: 5601
targetPort: 5601
nodePort: 31601
|
kubectl apply -f kibana.yml
查看:
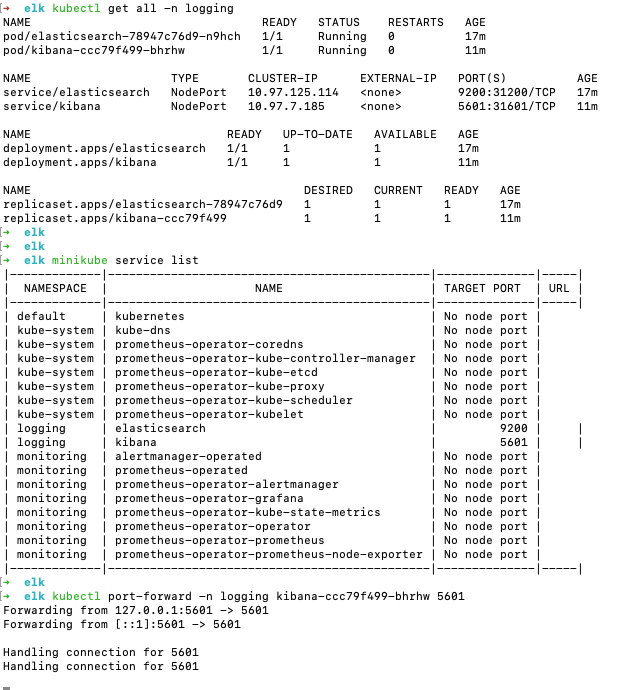
kubectl get all -n logging
minikube service list
执行
kubectl port-forward -n logging kibana-ccc79f499-bhrhw 5601
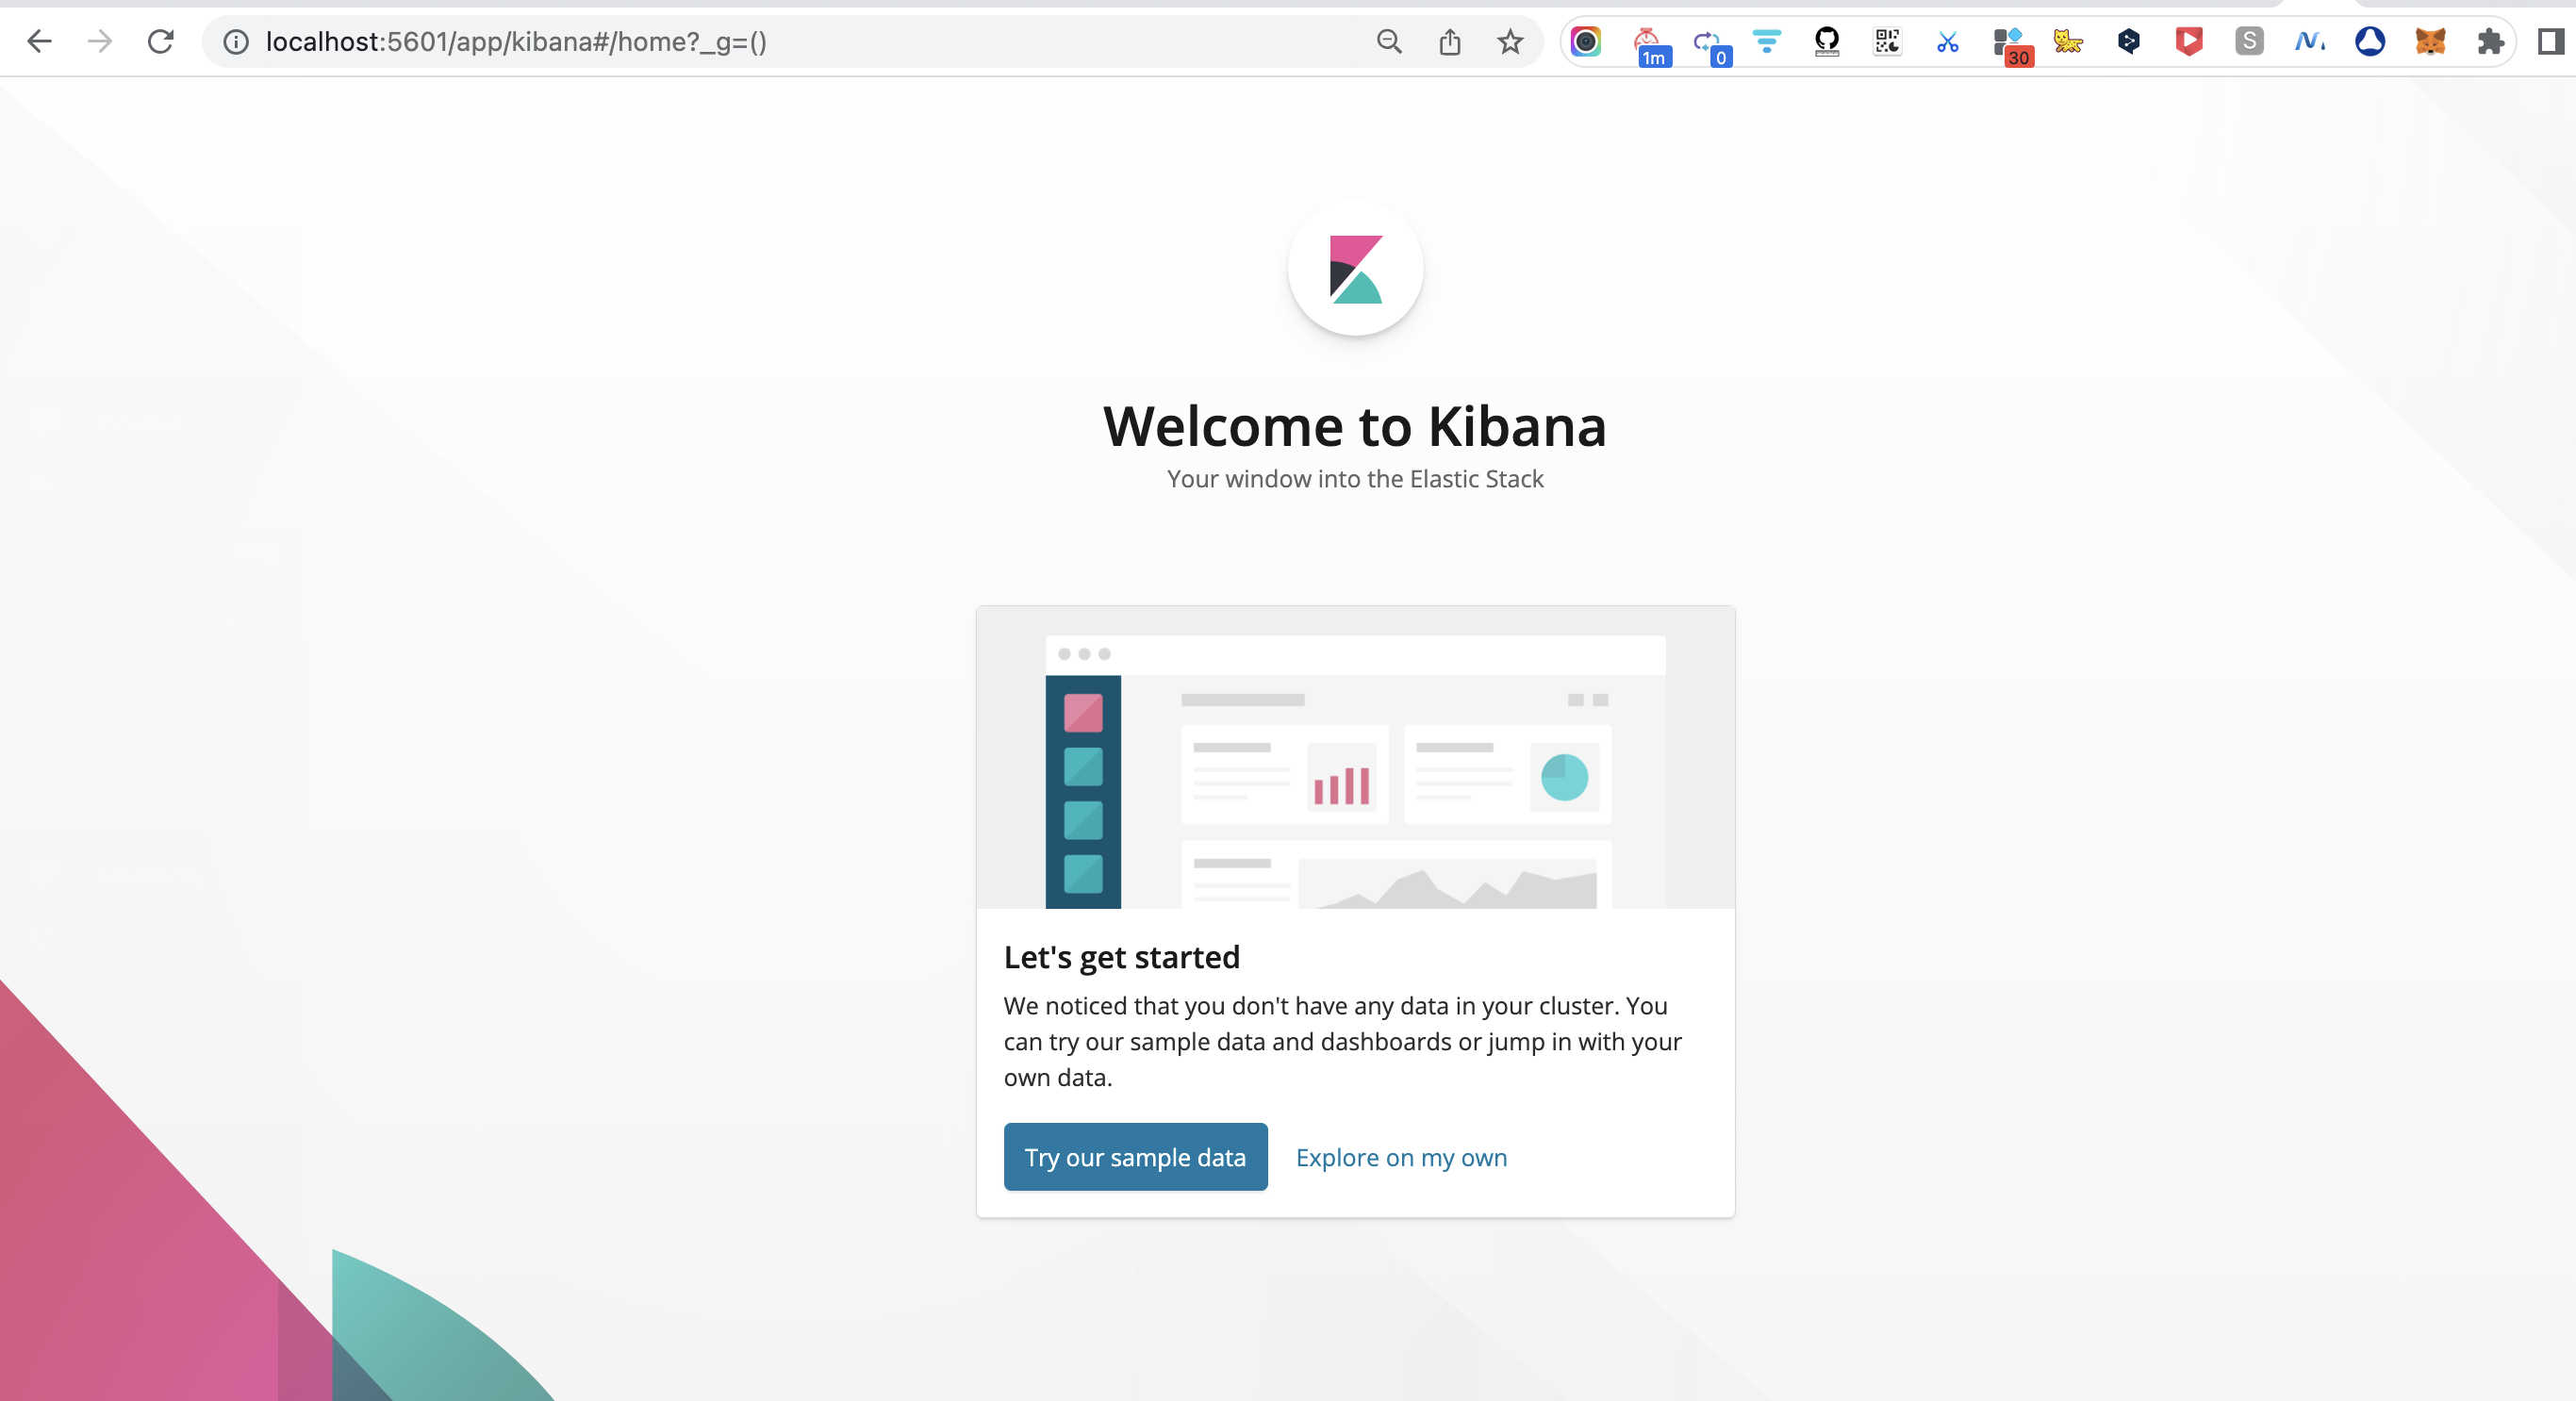
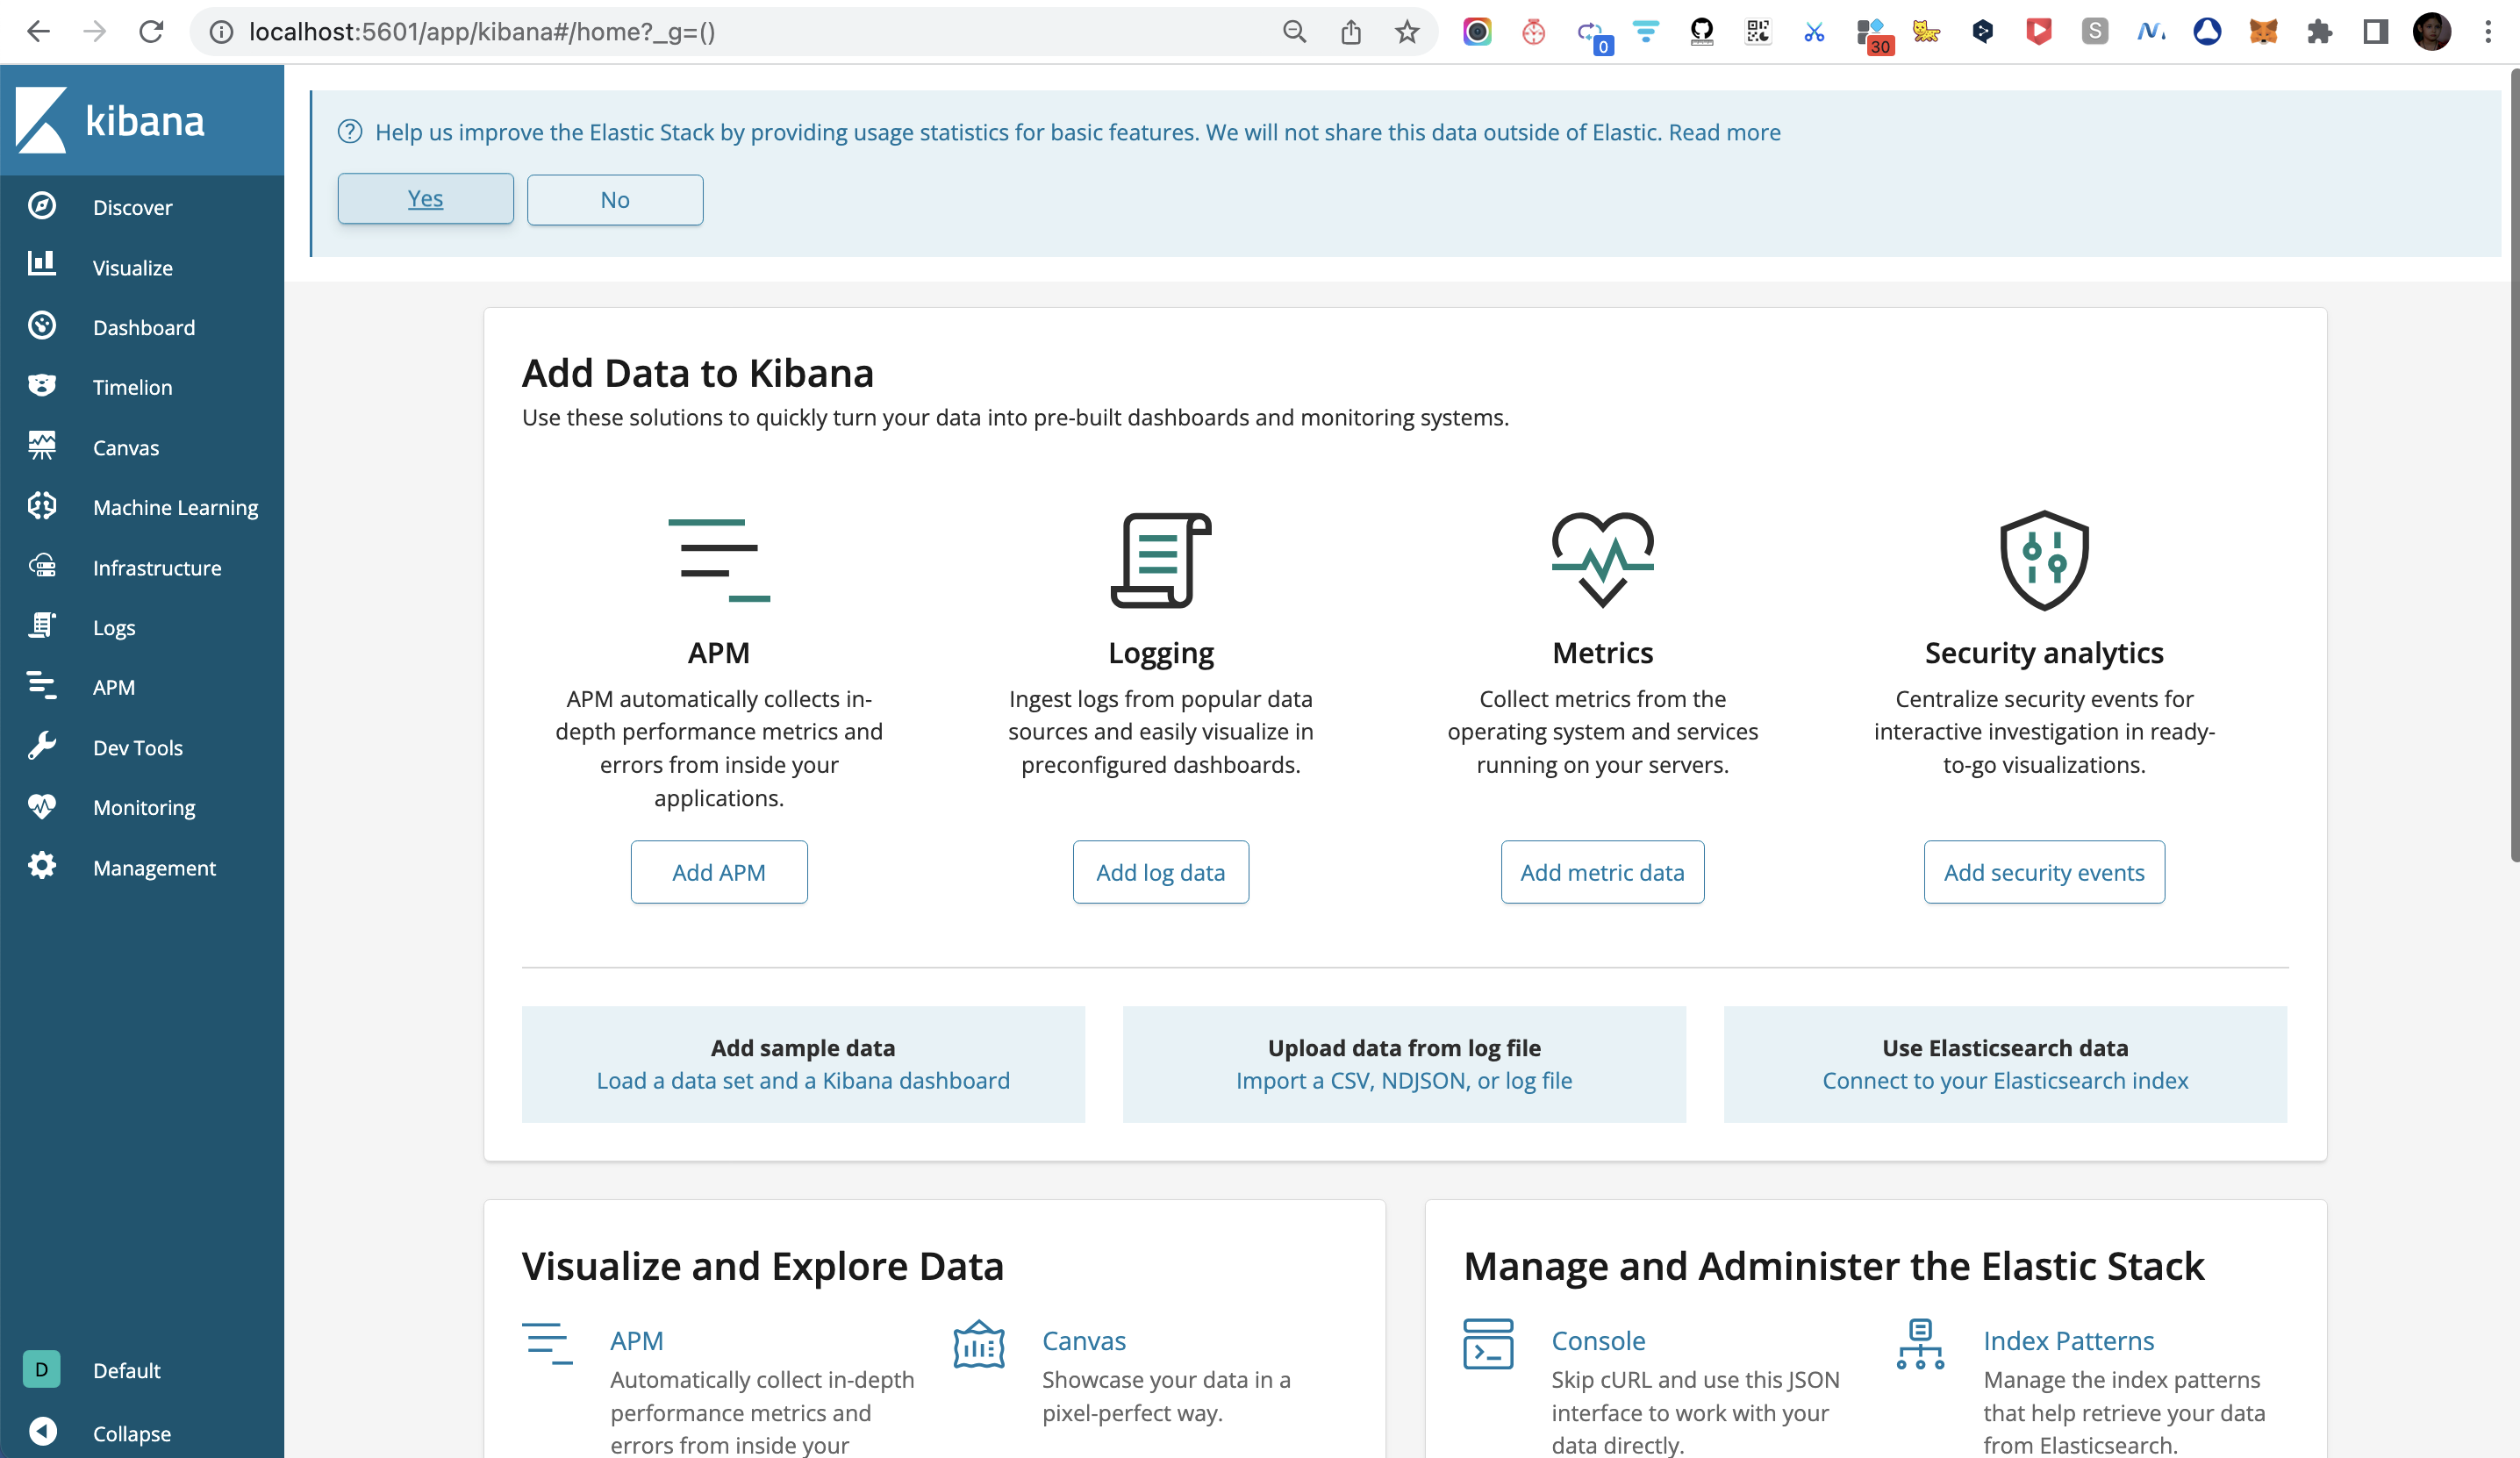
校验Kibana
访问 http://localhost:5601/
Kibana server is not ready yet
kibana 报错 server is not ready yet 可能的原因
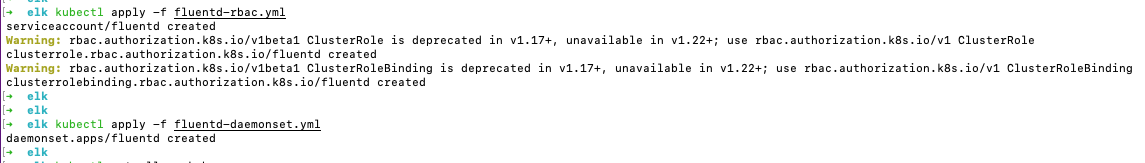
发布Fluentd
执行:
kubectl apply -f fluentd-rbac.yml
kubectl apply -f fluentd-daemonset.yml
查看:
kubectl get all -n kube-system
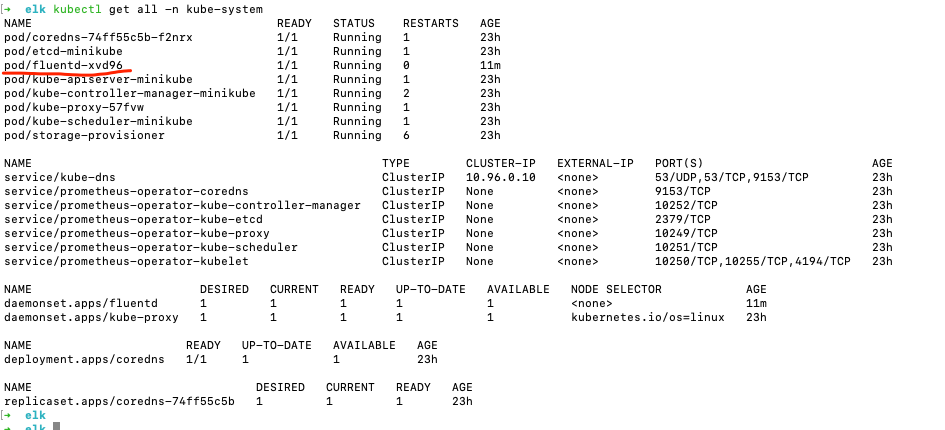
校验Fluentd启动日志
Pod可能要创建半天ke
可以通过 kubectl describe po fluentd-xvd96 -n kube-system 及kubectl logs fluentd-xvd96 -n kube-system 查看
1
2
3
4
5
6
7
8
9
10
11
12
13
14
15
16
17
18
19
20
21
22
23
24
25
26
27
28
29
30
31
32
33
34
35
36
37
38
39
40
41
42
43
44
45
46
47
48
49
50
51
52
53
54
55
56
57
58
59
60
61
62
63
64
65
66
67
68
69
70
71
72
73
74
75
76
77
78
79
80
| kubectl describe po fluentd-xvd96 -n kube-system
Name: fluentd-xvd96
Namespace: kube-system
Priority: 0
Service Account: fluentd
Node: minikube/192.168.49.2
Start Time: Fri, 30 Jun 2023 14:14:23 +0800
Labels: controller-revision-hash=769b886657
k8s-app=fluentd-logging
kubernetes.io/cluster-service=true
pod-template-generation=1
version=v1
Annotations: <none>
Status: Running
IP: 172.17.0.10
IPs:
IP: 172.17.0.10
Controlled By: DaemonSet/fluentd
Containers:
fluentd:
Container ID: docker://b1dafd815c311280ed771b244249af18d4750bcb35495ad4c847d6968a1a4ab1
Image: fluent/fluentd-kubernetes-daemonset:v1-debian-elasticsearch
Image ID: docker-pullable://fluent/fluentd-kubernetes-daemonset@sha256:c3a0797e96b544b8b1a9899a322bc54fffafee90a079b7ae7e78dde6f569a5a4
Port: <none>
Host Port: <none>
State: Running
Started: Fri, 30 Jun 2023 14:20:51 +0800
Ready: True
Restart Count: 0
Limits:
memory: 200Mi
Requests:
cpu: 100m
memory: 200Mi
Environment:
FLUENT_ELASTICSEARCH_HOST: elasticsearch.logging
FLUENT_ELASTICSEARCH_PORT: 9200
FLUENT_ELASTICSEARCH_SCHEME: http
FLUENT_UID: 0
FLUENTD_SYSTEMD_CONF: disable
Mounts:
/var/lib/docker/containers from varlibdockercontainers (ro)
/var/log from varlog (rw)
/var/run/secrets/kubernetes.io/serviceaccount from fluentd-token-mrn96 (ro)
Conditions:
Type Status
Initialized True
Ready True
ContainersReady True
PodScheduled True
Volumes:
varlog:
Type: HostPath (bare host directory volume)
Path: /var/log
HostPathType:
varlibdockercontainers:
Type: HostPath (bare host directory volume)
Path: /var/lib/docker/containers
HostPathType:
fluentd-token-mrn96:
Type: Secret (a volume populated by a Secret)
SecretName: fluentd-token-mrn96
Optional: false
QoS Class: Burstable
Node-Selectors: <none>
Tolerations: node-role.kubernetes.io/master:NoSchedule
node.kubernetes.io/disk-pressure:NoSchedule op=Exists
node.kubernetes.io/memory-pressure:NoSchedule op=Exists
node.kubernetes.io/not-ready:NoExecute op=Exists
node.kubernetes.io/pid-pressure:NoSchedule op=Exists
node.kubernetes.io/unreachable:NoExecute op=Exists
node.kubernetes.io/unschedulable:NoSchedule op=Exists
Events:
Type Reason Age From Message
---- ------ ---- ---- -------
Normal Scheduled 11m default-scheduler Successfully assigned kube-system/fluentd-xvd96 to minikube
Normal Pulling 11m kubelet Pulling image "fluent/fluentd-kubernetes-daemonset:v1-debian-elasticsearch"
Normal Pulled 5m14s kubelet Successfully pulled image "fluent/fluentd-kubernetes-daemonset:v1-debian-elasticsearch" in 6m22.241646424s
Normal Created 5m13s kubelet Created container fluentd
Normal Started 5m12s kubelet Started container fluentd
|
1
2
3
4
5
6
7
8
9
10
11
12
13
14
15
16
17
18
19
20
21
22
23
24
25
26
27
28
29
30
31
32
33
34
35
36
37
38
39
40
41
42
43
44
45
46
47
48
49
50
51
52
53
54
55
56
57
58
59
60
61
62
63
64
65
66
67
68
69
70
71
72
73
74
75
76
77
78
79
80
81
82
83
84
85
86
87
88
89
90
91
92
93
94
95
96
97
98
99
100
101
102
103
104
105
106
107
108
109
110
111
112
113
114
115
116
117
118
119
120
121
122
123
124
125
126
127
128
129
130
131
132
133
134
135
136
137
138
139
140
141
142
143
144
145
146
147
148
149
150
151
152
153
154
155
156
157
158
159
160
161
162
163
164
165
166
167
168
169
170
171
172
173
174
175
176
177
178
179
180
181
182
183
184
185
186
187
188
189
190
191
192
193
194
195
196
197
198
199
200
201
202
203
204
205
206
207
208
209
210
211
212
213
214
215
216
217
218
219
220
221
222
223
224
225
226
227
228
229
230
231
232
233
234
235
236
237
238
239
240
241
242
243
244
245
246
247
248
249
250
251
252
253
254
255
256
257
258
259
260
261
262
263
264
265
266
267
268
269
270
271
272
273
274
275
276
277
278
279
280
281
282
283
284
285
286
287
288
289
290
291
292
293
294
295
296
297
298
299
300
301
302
303
304
305
306
307
308
309
310
311
312
313
314
315
316
317
318
319
320
321
322
323
324
325
326
327
328
329
330
331
332
333
334
335
336
337
338
339
340
341
342
343
344
345
346
347
348
349
350
351
352
353
354
355
356
357
358
359
360
361
362
363
364
365
366
367
368
369
370
371
372
373
374
375
376
377
378
379
380
381
382
383
384
385
386
387
388
389
390
391
392
393
394
395
396
397
398
399
400
401
402
403
404
405
406
407
408
409
410
411
412
413
414
415
416
417
418
419
420
421
422
423
424
425
426
427
428
429
430
431
432
433
434
435
436
437
438
439
440
441
442
443
444
445
446
447
448
449
450
451
452
453
454
455
456
457
458
459
460
461
462
463
464
465
466
467
468
469
470
471
472
473
474
475
476
477
478
479
480
481
| 2023-06-30 06:20:56 +0000 [info]: init supervisor logger path=nil rotate_age=nil rotate_size=nil
2023-06-30 06:20:56 +0000 [info]: parsing config file is succeeded path="/fluentd/etc/fluent.conf"
2023-06-30 06:20:58 +0000 [info]: gem 'fluentd' version '1.16.1'
2023-06-30 06:20:58 +0000 [info]: gem 'fluent-plugin-concat' version '2.5.0'
2023-06-30 06:20:58 +0000 [info]: gem 'fluent-plugin-dedot_filter' version '1.0.0'
2023-06-30 06:20:58 +0000 [info]: gem 'fluent-plugin-detect-exceptions' version '0.0.15'
2023-06-30 06:20:58 +0000 [info]: gem 'fluent-plugin-elasticsearch' version '5.2.5'
2023-06-30 06:20:58 +0000 [info]: gem 'fluent-plugin-grok-parser' version '2.6.2'
2023-06-30 06:20:58 +0000 [info]: gem 'fluent-plugin-json-in-json-2' version '1.0.2'
2023-06-30 06:20:58 +0000 [info]: gem 'fluent-plugin-kubernetes_metadata_filter' version '3.2.0'
2023-06-30 06:20:58 +0000 [info]: gem 'fluent-plugin-multi-format-parser' version '1.0.0'
2023-06-30 06:20:58 +0000 [info]: gem 'fluent-plugin-parser-cri' version '0.1.1'
2023-06-30 06:20:58 +0000 [info]: gem 'fluent-plugin-prometheus' version '2.0.3'
2023-06-30 06:20:58 +0000 [info]: gem 'fluent-plugin-record-modifier' version '2.1.1'
2023-06-30 06:20:58 +0000 [info]: gem 'fluent-plugin-rewrite-tag-filter' version '2.4.0'
2023-06-30 06:20:58 +0000 [info]: gem 'fluent-plugin-systemd' version '1.0.5'
2023-06-30 06:21:00 +0000 [warn]: [filter_kube_metadata] !! The environment variable 'K8S_NODE_NAME' is not set to the node name which can affect the API server and watch efficiency !!
2023-06-30 06:21:01 +0000 [info]: using configuration file: <ROOT>
<source>
@type prometheus
@id in_prometheus
bind "0.0.0.0"
port 24231
metrics_path "/metrics"
</source>
<source>
@type prometheus_output_monitor
@id in_prometheus_output_monitor
</source>
<label @FLUENT_LOG>
<match fluent.**>
@type null
@id ignore_fluent_logs
</match>
</label>
<source>
@type tail
@id in_tail_cluster_autoscaler
multiline_flush_interval 5s
path "/var/log/cluster-autoscaler.log"
pos_file "/var/log/fluentd-cluster-autoscaler.log.pos"
tag "cluster-autoscaler"
<parse>
@type "kubernetes"
unmatched_lines
expression /^(?<severity>\w)(?<time>\d{4} [^\s]*)\s+(?<pid>\d+)\s+(?<source>[^ \]]+)\] (?<message>.*)/m
time_format "%m%d %H:%M:%S.%N"
</parse>
</source>
<source>
@type tail
@id in_tail_container_logs
path "/var/log/containers/*.log"
pos_file "/var/log/fluentd-containers.log.pos"
tag "kubernetes.*"
exclude_path []
read_from_head true
<parse>
@type "json"
time_format "%Y-%m-%dT%H:%M:%S.%NZ"
unmatched_lines
time_type string
</parse>
</source>
<source>
@type tail
@id in_tail_docker
path "/var/log/docker.log"
pos_file "/var/log/fluentd-docker.log.pos"
tag "docker"
<parse>
@type "regexp"
expression /^time="(?<time>[^)]*)" level=(?<severity>[^ ]*) msg="(?<message>[^"]*)"( err="(?<error>[^"]*)")?( statusCode=($<status_code>\d+))?/
unmatched_lines
</parse>
</source>
<source>
@type tail
@id in_tail_etcd
path "/var/log/etcd.log"
pos_file "/var/log/fluentd-etcd.log.pos"
tag "etcd"
<parse>
@type "none"
unmatched_lines
</parse>
</source>
<source>
@type tail
@id in_tail_glbc
multiline_flush_interval 5s
path "/var/log/glbc.log"
pos_file "/var/log/fluentd-glbc.log.pos"
tag "glbc"
<parse>
@type "kubernetes"
unmatched_lines
expression /^(?<severity>\w)(?<time>\d{4} [^\s]*)\s+(?<pid>\d+)\s+(?<source>[^ \]]+)\] (?<message>.*)/m
time_format "%m%d %H:%M:%S.%N"
</parse>
</source>
<source>
@type tail
@id in_tail_kube_apiserver_audit
multiline_flush_interval 5s
path "/var/log/kubernetes/kube-apiserver-audit.log"
pos_file "/var/log/kube-apiserver-audit.log.pos"
tag "kube-apiserver-audit"
<parse>
@type "multiline"
format_firstline "/^\\S+\\s+AUDIT:/"
format1 /^(?<time>\S+) AUDIT:(?: (?:id="(?<id>(?:[^"\\]|\\.)*)"|ip="(?<ip>(?:[^"\\]|\\.)*)"|method="(?<method>(?:[^"\\]|\\.)*)"|user="(?<user>(?:[^"\\]|\\.)*)"|groups="(?<groups>(?:[^"\\]|\\.)*)"|as="(?<as>(?:[^"\\]|\\.)*)"|asgroups="(?<asgroups>(?:[^"\\]|\\.)*)"|namespace="(?<namespace>(?:[^"\\]|\\.)*)"|uri="(?<uri>(?:[^"\\]|\\.)*)"|response="(?<response>(?:[^"\\]|\\.)*)"|\w+="(?:[^"\\]|\\.)*"))*/
time_format "%Y-%m-%dT%T.%L%Z"
unmatched_lines
</parse>
</source>
<source>
@type tail
@id in_tail_kube_apiserver
multiline_flush_interval 5s
path "/var/log/kube-apiserver.log"
pos_file "/var/log/fluentd-kube-apiserver.log.pos"
tag "kube-apiserver"
<parse>
@type "kubernetes"
unmatched_lines
expression /^(?<severity>\w)(?<time>\d{4} [^\s]*)\s+(?<pid>\d+)\s+(?<source>[^ \]]+)\] (?<message>.*)/m
time_format "%m%d %H:%M:%S.%N"
</parse>
</source>
<source>
@type tail
@id in_tail_kube_controller_manager
multiline_flush_interval 5s
path "/var/log/kube-controller-manager.log"
pos_file "/var/log/fluentd-kube-controller-manager.log.pos"
tag "kube-controller-manager"
<parse>
@type "kubernetes"
unmatched_lines
expression /^(?<severity>\w)(?<time>\d{4} [^\s]*)\s+(?<pid>\d+)\s+(?<source>[^ \]]+)\] (?<message>.*)/m
time_format "%m%d %H:%M:%S.%N"
</parse>
</source>
<source>
@type tail
@id in_tail_kube_proxy
multiline_flush_interval 5s
path "/var/log/kube-proxy.log"
pos_file "/var/log/fluentd-kube-proxy.log.pos"
tag "kube-proxy"
<parse>
@type "kubernetes"
unmatched_lines
expression /^(?<severity>\w)(?<time>\d{4} [^\s]*)\s+(?<pid>\d+)\s+(?<source>[^ \]]+)\] (?<message>.*)/m
time_format "%m%d %H:%M:%S.%N"
</parse>
</source>
<source>
@type tail
@id in_tail_kube_scheduler
multiline_flush_interval 5s
path "/var/log/kube-scheduler.log"
pos_file "/var/log/fluentd-kube-scheduler.log.pos"
tag "kube-scheduler"
<parse>
@type "kubernetes"
unmatched_lines
expression /^(?<severity>\w)(?<time>\d{4} [^\s]*)\s+(?<pid>\d+)\s+(?<source>[^ \]]+)\] (?<message>.*)/m
time_format "%m%d %H:%M:%S.%N"
</parse>
</source>
<source>
@type tail
@id in_tail_kubelet
multiline_flush_interval 5s
path "/var/log/kubelet.log"
pos_file "/var/log/fluentd-kubelet.log.pos"
tag "kubelet"
<parse>
@type "kubernetes"
unmatched_lines
expression /^(?<severity>\w)(?<time>\d{4} [^\s]*)\s+(?<pid>\d+)\s+(?<source>[^ \]]+)\] (?<message>.*)/m
time_format "%m%d %H:%M:%S.%N"
</parse>
</source>
<source>
@type tail
@id in_tail_rescheduler
multiline_flush_interval 5s
path "/var/log/rescheduler.log"
pos_file "/var/log/fluentd-rescheduler.log.pos"
tag "rescheduler"
<parse>
@type "kubernetes"
unmatched_lines
expression /^(?<severity>\w)(?<time>\d{4} [^\s]*)\s+(?<pid>\d+)\s+(?<source>[^ \]]+)\] (?<message>.*)/m
time_format "%m%d %H:%M:%S.%N"
</parse>
</source>
<source>
@type tail
@id in_tail_minion
path "/var/log/salt/minion"
pos_file "/var/log/fluentd-salt.pos"
tag "salt"
<parse>
@type "regexp"
expression /^(?<time>[^ ]* [^ ,]*)[^\[]*\[[^\]]*\]\[(?<severity>[^ \]]*) *\] (?<message>.*)$/
time_format "%Y-%m-%d %H:%M:%S"
unmatched_lines
</parse>
</source>
<source>
@type tail
@id in_tail_startupscript
path "/var/log/startupscript.log"
pos_file "/var/log/fluentd-startupscript.log.pos"
tag "startupscript"
<parse>
@type "syslog"
unmatched_lines
</parse>
</source>
<filter kubernetes.**>
@type kubernetes_metadata
@id filter_kube_metadata
kubernetes_url "https://10.96.0.1:443/api"
verify_ssl true
ca_file ""
skip_labels false
skip_container_metadata false
skip_master_url false
skip_namespace_metadata false
watch true
</filter>
<match **>
@type elasticsearch
@id out_es
@log_level "info"
include_tag_key true
host "elasticsearch.logging"
port 9200
path ""
scheme http
ssl_verify true
ssl_version TLSv1_2
user
password xxxxxx
reload_connections false
reconnect_on_error true
reload_on_failure true
log_es_400_reason false
logstash_prefix "logstash"
logstash_dateformat "%Y.%m.%d"
logstash_format true
index_name "logstash"
target_index_key
type_name "fluentd"
include_timestamp false
template_name
template_file
template_overwrite false
sniffer_class_name "Fluent::Plugin::ElasticsearchSimpleSniffer"
request_timeout 5s
application_name default
suppress_type_name true
enable_ilm false
ilm_policy_id logstash-policy
ilm_policy {}
ilm_policy_overwrite false
<buffer>
flush_thread_count 8
flush_interval 5s
chunk_limit_size 2M
queue_limit_length 32
retry_max_interval 30
retry_forever true
</buffer>
</match>
</ROOT>
2023-06-30 06:21:01 +0000 [info]: starting fluentd-1.16.1 pid=7 ruby="3.1.4"
2023-06-30 06:21:01 +0000 [info]: spawn command to main: cmdline=["/usr/local/bin/ruby", "-Eascii-8bit:ascii-8bit", "/fluentd/vendor/bundle/ruby/3.1.0/bin/fluentd", "-c", "/fluentd/etc/fluent.conf", "-p", "/fluentd/plugins", "--gemfile", "/fluentd/Gemfile", "-r", "/fluentd/vendor/bundle/ruby/3.1.0/gems/fluent-plugin-elasticsearch-5.2.5/lib/fluent/plugin/elasticsearch_simple_sniffer.rb", "--under-supervisor"]
2023-06-30 06:21:04 +0000 [info]: #0 init worker0 logger path=nil rotate_age=nil rotate_size=nil
2023-06-30 06:21:04 +0000 [info]: adding match in @FLUENT_LOG pattern="fluent.**" type="null"
2023-06-30 06:21:04 +0000 [info]: adding filter pattern="kubernetes.**" type="kubernetes_metadata"
2023-06-30 06:21:05 +0000 [warn]: #0 [filter_kube_metadata] !! The environment variable 'K8S_NODE_NAME' is not set to the node name which can affect the API server and watch efficiency !!
2023-06-30 06:21:05 +0000 [info]: adding match pattern="**" type="elasticsearch"
2023-06-30 06:21:05 +0000 [info]: #0 [out_es] Detected ES 6.x: ES 7.x will only accept `_doc` in type_name.
2023-06-30 06:21:05 +0000 [info]: adding source type="prometheus"
2023-06-30 06:21:05 +0000 [info]: adding source type="prometheus_output_monitor"
2023-06-30 06:21:05 +0000 [info]: adding source type="tail"
2023-06-30 06:21:05 +0000 [info]: adding source type="tail"
2023-06-30 06:21:05 +0000 [info]: adding source type="tail"
2023-06-30 06:21:05 +0000 [info]: adding source type="tail"
2023-06-30 06:21:05 +0000 [info]: adding source type="tail"
2023-06-30 06:21:05 +0000 [info]: adding source type="tail"
2023-06-30 06:21:05 +0000 [info]: adding source type="tail"
2023-06-30 06:21:05 +0000 [info]: adding source type="tail"
2023-06-30 06:21:05 +0000 [info]: adding source type="tail"
2023-06-30 06:21:05 +0000 [info]: adding source type="tail"
2023-06-30 06:21:05 +0000 [info]: adding source type="tail"
2023-06-30 06:21:05 +0000 [info]: adding source type="tail"
2023-06-30 06:21:05 +0000 [info]: adding source type="tail"
2023-06-30 06:21:05 +0000 [info]: adding source type="tail"
2023-06-30 06:21:05 +0000 [info]: #0 starting fluentd worker pid=18 ppid=7 worker=0
2023-06-30 06:21:05 +0000 [info]: #0 [in_tail_container_logs] following tail of /var/log/containers/alertmanager-prometheus-operator-alertmanager-0_monitoring_alertmanager-7102f9364d1f5c2cb8e52d7fb61ec56d750b962e48dd5a6e56cc0f1a259e794b.log
2023-06-30 06:21:05 +0000 [info]: #0 [in_tail_container_logs] following tail of /var/log/containers/alertmanager-prometheus-operator-alertmanager-0_monitoring_alertmanager-ffb0b992246295adb6ba72eb7e28a87ee530529d007cfdd17ada3c5171809c79.log
2023-06-30 06:21:06 +0000 [info]: #0 [in_tail_container_logs] following tail of /var/log/containers/alertmanager-prometheus-operator-alertmanager-0_monitoring_config-reloader-b7b8f82a5d90276cd06da264234d3ec3b89686ea4b0d906ebb25e340f3b7870d.log
2023-06-30 06:21:06 +0000 [info]: #0 [in_tail_container_logs] following tail of /var/log/containers/alertmanager-prometheus-operator-alertmanager-0_monitoring_config-reloader-be977456ad0e09b4b9e44ac36de640b5e05aa78618e6caa82610ff0bc9fd960d.log
2023-06-30 06:21:06 +0000 [info]: #0 [in_tail_container_logs] following tail of /var/log/containers/coredns-74ff55c5b-f2nrx_kube-system_coredns-58535971f6a74d691d0c3c95bb116d7fb4804e770a49add4a37907a0755513a1.log
2023-06-30 06:21:06 +0000 [info]: #0 [in_tail_container_logs] following tail of /var/log/containers/coredns-74ff55c5b-f2nrx_kube-system_coredns-a14a79ee667a375d4d0fc1568fd48af6d1d6eab0b7f18652ed45b5adbf172c10.log
2023-06-30 06:21:06 +0000 [info]: #0 [in_tail_container_logs] following tail of /var/log/containers/elasticsearch-66449789c5-7cqtf_logging_elasticsearch-4856447cbe09478e899a6872a90f603f8c9041f81f9dce75c2b5208be00a3768.log
2023-06-30 06:21:06 +0000 [info]: #0 [in_tail_container_logs] following tail of /var/log/containers/etcd-minikube_kube-system_etcd-516d45a864179b46731689cc311ad427433081a38c144410bbe52ce4ffd3869e.log
2023-06-30 06:21:06 +0000 [info]: #0 [in_tail_container_logs] following tail of /var/log/containers/etcd-minikube_kube-system_etcd-69bb6967229628cf22d4429c2b1b35a378e52f1bf645b54decd121449b8a0d17.log
2023-06-30 06:21:06 +0000 [info]: #0 [in_tail_container_logs] following tail of /var/log/containers/fluentd-xvd96_kube-system_fluentd-b1dafd815c311280ed771b244249af18d4750bcb35495ad4c847d6968a1a4ab1.log
2023-06-30 06:21:06 +0000 [info]: #0 [in_tail_container_logs] following tail of /var/log/containers/kibana-ccc79f499-5wdhc_logging_kibana-48f12c8f142e13b5bbb7029223281727afb39e145178464babadeb7c0455c4a4.log
2023-06-30 06:21:06 +0000 [info]: #0 [in_tail_container_logs] following tail of /var/log/containers/kube-apiserver-minikube_kube-system_kube-apiserver-65afa0892697955ca3982eeeb74fa9fd520a09883572b95ed14c4509549ee4fc.log
2023-06-30 06:21:07 +0000 [info]: #0 [in_tail_container_logs] following tail of /var/log/containers/kube-apiserver-minikube_kube-system_kube-apiserver-7970f7aa693099e3d7727fd2dcc34f9d65048503c08ae1fedb1a721aa17c02ed.log
2023-06-30 06:21:07 +0000 [info]: #0 [in_tail_container_logs] following tail of /var/log/containers/kube-controller-manager-minikube_kube-system_kube-controller-manager-5e6a62924295b4a37feec1384b51fbf01720aabfe24fa009c4ad91a734c41e98.log
2023-06-30 06:21:07 +0000 [info]: #0 [in_tail_container_logs] following tail of /var/log/containers/kube-controller-manager-minikube_kube-system_kube-controller-manager-b483f4f18764416a0d4e59e89882efe89992cd73f435839db5962ad19616b9fd.log
2023-06-30 06:21:07 +0000 [info]: #0 [in_tail_container_logs] following tail of /var/log/containers/kube-proxy-57fvw_kube-system_kube-proxy-5351da10dc294d78a25b290591df2e11113c192c92999b1d4532e31f04f22bde.log
2023-06-30 06:21:07 +0000 [info]: #0 [in_tail_container_logs] following tail of /var/log/containers/kube-proxy-57fvw_kube-system_kube-proxy-ae0ce04856b0d0248bd860d74adea968940fd306d371f08866cae8ec53775a21.log
2023-06-30 06:21:07 +0000 [info]: #0 [in_tail_container_logs] following tail of /var/log/containers/kube-scheduler-minikube_kube-system_kube-scheduler-fdf5c317a7cc4a707e38f0a5c754f857a29ccb1e9dd7e7fcb7669642e903ee38.log
2023-06-30 06:21:07 +0000 [info]: #0 [in_tail_container_logs] following tail of /var/log/containers/kube-scheduler-minikube_kube-system_kube-scheduler-fec9a5c7e4552dca3cf482427aac58e8fa264ce904650c493ad187f4783baeef.log
2023-06-30 06:21:07 +0000 [info]: #0 [in_tail_container_logs] following tail of /var/log/containers/prometheus-operator-grafana-686b547754-sr2pd_monitoring_grafana-6938de6baf2a5aa3626b6e9e7d79f09f6ecc1533b68b27680660c490ced412da.log
2023-06-30 06:21:07 +0000 [info]: #0 [in_tail_container_logs] following tail of /var/log/containers/prometheus-operator-grafana-686b547754-sr2pd_monitoring_grafana-fc7a242d5a40e7955c51e5a501e67aea28d7190f0cdfc189bd74dc6d59f5859d.log
2023-06-30 06:21:07 +0000 [info]: #0 [in_tail_container_logs] following tail of /var/log/containers/prometheus-operator-grafana-686b547754-sr2pd_monitoring_grafana-sc-dashboard-92ee63ff58e7851b83c42a77d5a8ca40cfcfda0548471fd7e1b743a0853cf9c5.log
2023-06-30 06:21:07 +0000 [info]: #0 [in_tail_container_logs] following tail of /var/log/containers/prometheus-operator-grafana-686b547754-sr2pd_monitoring_grafana-sc-dashboard-a4d45a2ff94fb7a15d6854a14d27f0d3b46dd467409099c0aa5b066f311a5ea5.log
2023-06-30 06:21:07 +0000 [info]: #0 [in_tail_container_logs] following tail of /var/log/containers/prometheus-operator-grafana-686b547754-sr2pd_monitoring_grafana-sc-datasources-6f6f25d286bfbb60efdac99305af0bd03814bf24265cd499cfe1504581005bd6.log
2023-06-30 06:21:07 +0000 [info]: #0 [in_tail_container_logs] following tail of /var/log/containers/prometheus-operator-kube-state-metrics-bd8f49464-76n5z_monitoring_kube-state-metrics-002d5c5f80bb8157c3890a479b850a1a1f7d4614a1cd932a2a2a28ba1788a98b.log
2023-06-30 06:21:07 +0000 [info]: #0 [in_tail_container_logs] following tail of /var/log/containers/prometheus-operator-kube-state-metrics-bd8f49464-76n5z_monitoring_kube-state-metrics-0569316f46e8cbe1926ec73d0fe8f063fa3b3c98cea1a9bf630675cf539b58e4.log
2023-06-30 06:21:07 +0000 [info]: #0 [in_tail_container_logs] following tail of /var/log/containers/prometheus-operator-operator-7dfc554db-zs5qk_monitoring_prometheus-operator-67d7c84beb729709c847ff2c519f8696cbb97ee557a2ff386d6aad7b32a6ba0e.log
2023-06-30 06:21:07 +0000 [info]: #0 [in_tail_container_logs] following tail of /var/log/containers/prometheus-operator-operator-7dfc554db-zs5qk_monitoring_prometheus-operator-c78d9511bd16e942df315fd74b7656e6feaf050d8f6a5b87e56bc67a7571afdb.log
2023-06-30 06:21:08 +0000 [info]: #0 [in_tail_container_logs] following tail of /var/log/containers/prometheus-operator-operator-7dfc554db-zs5qk_monitoring_tls-proxy-45294d735be1fbdfc1310c0a3edb12e1987366321be9a646d87f9698df22ddbd.log
2023-06-30 06:21:08 +0000 [info]: #0 [in_tail_container_logs] following tail of /var/log/containers/prometheus-operator-operator-7dfc554db-zs5qk_monitoring_tls-proxy-fe3976fe06f9a2fb2a97ee939a6cd0101c4c1d3133163e227bb467e7cd2b49fc.log
2023-06-30 06:21:08 +0000 [info]: #0 [in_tail_container_logs] following tail of /var/log/containers/prometheus-operator-prometheus-node-exporter-tkqdj_monitoring_node-exporter-07b2f7a5c62c024cf8eb078d47c88cda357cb1a0b925cbb179ab27a57a6d77e2.log
2023-06-30 06:21:08 +0000 [info]: #0 [in_tail_container_logs] following tail of /var/log/containers/prometheus-operator-prometheus-node-exporter-tkqdj_monitoring_node-exporter-9c75639760d1a68b64959c96e57ec0e5bf64cc4ca765835b0b3844d048abf12d.log
2023-06-30 06:21:08 +0000 [info]: #0 [in_tail_container_logs] following tail of /var/log/containers/prometheus-prometheus-operator-prometheus-0_monitoring_prometheus-9438325bb2adffa697441fab1aa2c58d1167ab866ff127705c6f2604d2d54b32.log
2023-06-30 06:21:08 +0000 [info]: #0 [in_tail_container_logs] following tail of /var/log/containers/prometheus-prometheus-operator-prometheus-0_monitoring_prometheus-9b223e799f8fb4e26a3795be5ab54b9a3b8e82affd80798bc7efcf193f2a0707.log
2023-06-30 06:21:08 +0000 [info]: #0 [in_tail_container_logs] following tail of /var/log/containers/prometheus-prometheus-operator-prometheus-0_monitoring_prometheus-config-reloader-112ec580da0b7ff60b75bb4e7d8d577ec3013af0d5298fb52c4dfc58b548a920.log
2023-06-30 06:21:08 +0000 [info]: #0 [in_tail_container_logs] following tail of /var/log/containers/prometheus-prometheus-operator-prometheus-0_monitoring_prometheus-config-reloader-1b2fa318671df8be8058235da19ae3e133b3236da01cb8f0a20d6ca7263b575d.log
2023-06-30 06:21:08 +0000 [info]: #0 [in_tail_container_logs] following tail of /var/log/containers/prometheus-prometheus-operator-prometheus-0_monitoring_rules-configmap-reloader-694f6e36dbc7f7535cf74d0be934c4077d6c122b81634df9023090fe73103fd2.log
2023-06-30 06:21:08 +0000 [info]: #0 [in_tail_container_logs] following tail of /var/log/containers/prometheus-prometheus-operator-prometheus-0_monitoring_rules-configmap-reloader-e2a36fa534d2938c2e12330d00172e1bfa06732ab1ac26eb45e70d0fc8280e04.log
2023-06-30 06:21:08 +0000 [info]: #0 [in_tail_container_logs] following tail of /var/log/containers/storage-provisioner_kube-system_storage-provisioner-09b182b297263589c290e003a39c76677b15658052d33b13612ac5918829938d.log
2023-06-30 06:21:08 +0000 [info]: #0 [in_tail_container_logs] following tail of /var/log/containers/storage-provisioner_kube-system_storage-provisioner-9a6f638f04aa5c62da6cce47ecd2b9bdd5e0081c1bdd419bd6ee8b966647aabb.log
2023-06-30 06:21:08 +0000 [info]: #0 fluentd worker is now running worker=0
2023-06-30 06:21:16 +0000 [warn]: #0 [out_es] failed to flush the buffer. retry_times=0 next_retry_time=2023-06-30 06:21:17 +0000 chunk="5ff52d26817a5c28f7c0522302e4197e" error_class=Fluent::Plugin::ElasticsearchOutput::RecoverableRequestFailure error="could not push logs to Elasticsearch cluster ({:host=>\"elasticsearch.logging\", :port=>9200, :scheme=>\"http\", :path=>\"\"}): read timeout reached"
2023-06-30 06:21:16 +0000 [warn]: #0 /fluentd/vendor/bundle/ruby/3.1.0/gems/fluent-plugin-elasticsearch-5.2.5/lib/fluent/plugin/out_elasticsearch.rb:1146:in `rescue in send_bulk'
2023-06-30 06:21:16 +0000 [warn]: #0 /fluentd/vendor/bundle/ruby/3.1.0/gems/fluent-plugin-elasticsearch-5.2.5/lib/fluent/plugin/out_elasticsearch.rb:1108:in `send_bulk'
2023-06-30 06:21:16 +0000 [warn]: #0 /fluentd/vendor/bundle/ruby/3.1.0/gems/fluent-plugin-elasticsearch-5.2.5/lib/fluent/plugin/out_elasticsearch.rb:884:in `block in write'
2023-06-30 06:21:16 +0000 [warn]: #0 /fluentd/vendor/bundle/ruby/3.1.0/gems/fluent-plugin-elasticsearch-5.2.5/lib/fluent/plugin/out_elasticsearch.rb:883:in `each'
2023-06-30 06:21:16 +0000 [warn]: #0 /fluentd/vendor/bundle/ruby/3.1.0/gems/fluent-plugin-elasticsearch-5.2.5/lib/fluent/plugin/out_elasticsearch.rb:883:in `write'
2023-06-30 06:21:16 +0000 [warn]: #0 /fluentd/vendor/bundle/ruby/3.1.0/gems/fluentd-1.16.1/lib/fluent/plugin/output.rb:1225:in `try_flush'
2023-06-30 06:21:16 +0000 [warn]: #0 /fluentd/vendor/bundle/ruby/3.1.0/gems/fluentd-1.16.1/lib/fluent/plugin/output.rb:1538:in `flush_thread_run'
2023-06-30 06:21:16 +0000 [warn]: #0 /fluentd/vendor/bundle/ruby/3.1.0/gems/fluentd-1.16.1/lib/fluent/plugin/output.rb:510:in `block (2 levels) in start'
2023-06-30 06:21:16 +0000 [warn]: #0 /fluentd/vendor/bundle/ruby/3.1.0/gems/fluentd-1.16.1/lib/fluent/plugin_helper/thread.rb:78:in `block in thread_create'
2023-06-30 06:21:18 +0000 [warn]: #0 [out_es] failed to flush the buffer. retry_times=1 next_retry_time=2023-06-30 06:21:20 +0000 chunk="5ff52d269914e440895ef25a39279dc8" error_class=Fluent::Plugin::ElasticsearchOutput::RecoverableRequestFailure error="could not push logs to Elasticsearch cluster ({:host=>\"elasticsearch.logging\", :port=>9200, :scheme=>\"http\", :path=>\"\"}): read timeout reached"
2023-06-30 06:21:18 +0000 [warn]: #0 /fluentd/vendor/bundle/ruby/3.1.0/gems/fluent-plugin-elasticsearch-5.2.5/lib/fluent/plugin/out_elasticsearch.rb:1146:in `rescue in send_bulk'
2023-06-30 06:21:18 +0000 [warn]: #0 /fluentd/vendor/bundle/ruby/3.1.0/gems/fluent-plugin-elasticsearch-5.2.5/lib/fluent/plugin/out_elasticsearch.rb:1108:in `send_bulk'
2023-06-30 06:21:18 +0000 [warn]: #0 /fluentd/vendor/bundle/ruby/3.1.0/gems/fluent-plugin-elasticsearch-5.2.5/lib/fluent/plugin/out_elasticsearch.rb:884:in `block in write'
2023-06-30 06:21:18 +0000 [warn]: #0 /fluentd/vendor/bundle/ruby/3.1.0/gems/fluent-plugin-elasticsearch-5.2.5/lib/fluent/plugin/out_elasticsearch.rb:883:in `each'
2023-06-30 06:21:18 +0000 [warn]: #0 /fluentd/vendor/bundle/ruby/3.1.0/gems/fluent-plugin-elasticsearch-5.2.5/lib/fluent/plugin/out_elasticsearch.rb:883:in `write'
2023-06-30 06:21:18 +0000 [warn]: #0 /fluentd/vendor/bundle/ruby/3.1.0/gems/fluentd-1.16.1/lib/fluent/plugin/output.rb:1225:in `try_flush'
2023-06-30 06:21:18 +0000 [warn]: #0 /fluentd/vendor/bundle/ruby/3.1.0/gems/fluentd-1.16.1/lib/fluent/plugin/output.rb:1538:in `flush_thread_run'
2023-06-30 06:21:18 +0000 [warn]: #0 /fluentd/vendor/bundle/ruby/3.1.0/gems/fluentd-1.16.1/lib/fluent/plugin/output.rb:510:in `block (2 levels) in start'
2023-06-30 06:21:18 +0000 [warn]: #0 /fluentd/vendor/bundle/ruby/3.1.0/gems/fluentd-1.16.1/lib/fluent/plugin_helper/thread.rb:78:in `block in thread_create'
2023-06-30 06:21:18 +0000 [warn]: #0 [out_es] failed to flush the buffer. retry_times=1 next_retry_time=2023-06-30 06:21:20 +0000 chunk="5ff52d26a0f7ab54a0c5aec00c38eab0" error_class=Fluent::Plugin::ElasticsearchOutput::RecoverableRequestFailure error="could not push logs to Elasticsearch cluster ({:host=>\"elasticsearch.logging\", :port=>9200, :scheme=>\"http\", :path=>\"\"}): read timeout reached"
2023-06-30 06:21:18 +0000 [warn]: #0 /fluentd/vendor/bundle/ruby/3.1.0/gems/fluent-plugin-elasticsearch-5.2.5/lib/fluent/plugin/out_elasticsearch.rb:1146:in `rescue in send_bulk'
2023-06-30 06:21:18 +0000 [warn]: #0 /fluentd/vendor/bundle/ruby/3.1.0/gems/fluent-plugin-elasticsearch-5.2.5/lib/fluent/plugin/out_elasticsearch.rb:1108:in `send_bulk'
2023-06-30 06:21:18 +0000 [warn]: #0 /fluentd/vendor/bundle/ruby/3.1.0/gems/fluent-plugin-elasticsearch-5.2.5/lib/fluent/plugin/out_elasticsearch.rb:884:in `block in write'
2023-06-30 06:21:18 +0000 [warn]: #0 /fluentd/vendor/bundle/ruby/3.1.0/gems/fluent-plugin-elasticsearch-5.2.5/lib/fluent/plugin/out_elasticsearch.rb:883:in `each'
2023-06-30 06:21:18 +0000 [warn]: #0 /fluentd/vendor/bundle/ruby/3.1.0/gems/fluent-plugin-elasticsearch-5.2.5/lib/fluent/plugin/out_elasticsearch.rb:883:in `write'
2023-06-30 06:21:18 +0000 [warn]: #0 /fluentd/vendor/bundle/ruby/3.1.0/gems/fluentd-1.16.1/lib/fluent/plugin/output.rb:1225:in `try_flush'
2023-06-30 06:21:18 +0000 [warn]: #0 /fluentd/vendor/bundle/ruby/3.1.0/gems/fluentd-1.16.1/lib/fluent/plugin/output.rb:1538:in `flush_thread_run'
2023-06-30 06:21:18 +0000 [warn]: #0 /fluentd/vendor/bundle/ruby/3.1.0/gems/fluentd-1.16.1/lib/fluent/plugin/output.rb:510:in `block (2 levels) in start'
2023-06-30 06:21:18 +0000 [warn]: #0 /fluentd/vendor/bundle/ruby/3.1.0/gems/fluentd-1.16.1/lib/fluent/plugin_helper/thread.rb:78:in `block in thread_create'
2023-06-30 06:21:18 +0000 [warn]: #0 [out_es] failed to flush the buffer. retry_times=1 next_retry_time=2023-06-30 06:21:20 +0000 chunk="5ff52d26b56ae37976da759e75e50233" error_class=Fluent::Plugin::ElasticsearchOutput::RecoverableRequestFailure error="could not push logs to Elasticsearch cluster ({:host=>\"elasticsearch.logging\", :port=>9200, :scheme=>\"http\", :path=>\"\"}): read timeout reached"
2023-06-30 06:21:18 +0000 [warn]: #0 /fluentd/vendor/bundle/ruby/3.1.0/gems/fluent-plugin-elasticsearch-5.2.5/lib/fluent/plugin/out_elasticsearch.rb:1146:in `rescue in send_bulk'
2023-06-30 06:21:18 +0000 [warn]: #0 /fluentd/vendor/bundle/ruby/3.1.0/gems/fluent-plugin-elasticsearch-5.2.5/lib/fluent/plugin/out_elasticsearch.rb:1108:in `send_bulk'
2023-06-30 06:21:18 +0000 [warn]: #0 /fluentd/vendor/bundle/ruby/3.1.0/gems/fluent-plugin-elasticsearch-5.2.5/lib/fluent/plugin/out_elasticsearch.rb:884:in `block in write'
2023-06-30 06:21:18 +0000 [warn]: #0 /fluentd/vendor/bundle/ruby/3.1.0/gems/fluent-plugin-elasticsearch-5.2.5/lib/fluent/plugin/out_elasticsearch.rb:883:in `each'
2023-06-30 06:21:18 +0000 [warn]: #0 /fluentd/vendor/bundle/ruby/3.1.0/gems/fluent-plugin-elasticsearch-5.2.5/lib/fluent/plugin/out_elasticsearch.rb:883:in `write'
2023-06-30 06:21:18 +0000 [warn]: #0 /fluentd/vendor/bundle/ruby/3.1.0/gems/fluentd-1.16.1/lib/fluent/plugin/output.rb:1225:in `try_flush'
2023-06-30 06:21:18 +0000 [warn]: #0 /fluentd/vendor/bundle/ruby/3.1.0/gems/fluentd-1.16.1/lib/fluent/plugin/output.rb:1538:in `flush_thread_run'
2023-06-30 06:21:18 +0000 [warn]: #0 /fluentd/vendor/bundle/ruby/3.1.0/gems/fluentd-1.16.1/lib/fluent/plugin/output.rb:510:in `block (2 levels) in start'
2023-06-30 06:21:18 +0000 [warn]: #0 /fluentd/vendor/bundle/ruby/3.1.0/gems/fluentd-1.16.1/lib/fluent/plugin_helper/thread.rb:78:in `block in thread_create'
2023-06-30 06:21:18 +0000 [warn]: #0 [out_es] failed to flush the buffer. retry_times=1 next_retry_time=2023-06-30 06:21:20 +0000 chunk="5ff52d26a943766b94555377d14fd79c" error_class=Fluent::Plugin::ElasticsearchOutput::RecoverableRequestFailure error="could not push logs to Elasticsearch cluster ({:host=>\"elasticsearch.logging\", :port=>9200, :scheme=>\"http\", :path=>\"\"}): read timeout reached"
2023-06-30 06:21:18 +0000 [warn]: #0 /fluentd/vendor/bundle/ruby/3.1.0/gems/fluent-plugin-elasticsearch-5.2.5/lib/fluent/plugin/out_elasticsearch.rb:1146:in `rescue in send_bulk'
2023-06-30 06:21:18 +0000 [warn]: #0 /fluentd/vendor/bundle/ruby/3.1.0/gems/fluent-plugin-elasticsearch-5.2.5/lib/fluent/plugin/out_elasticsearch.rb:1108:in `send_bulk'
2023-06-30 06:21:18 +0000 [warn]: #0 /fluentd/vendor/bundle/ruby/3.1.0/gems/fluent-plugin-elasticsearch-5.2.5/lib/fluent/plugin/out_elasticsearch.rb:884:in `block in write'
2023-06-30 06:21:18 +0000 [warn]: #0 /fluentd/vendor/bundle/ruby/3.1.0/gems/fluent-plugin-elasticsearch-5.2.5/lib/fluent/plugin/out_elasticsearch.rb:883:in `each'
2023-06-30 06:21:18 +0000 [warn]: #0 /fluentd/vendor/bundle/ruby/3.1.0/gems/fluent-plugin-elasticsearch-5.2.5/lib/fluent/plugin/out_elasticsearch.rb:883:in `write'
2023-06-30 06:21:18 +0000 [warn]: #0 /fluentd/vendor/bundle/ruby/3.1.0/gems/fluentd-1.16.1/lib/fluent/plugin/output.rb:1225:in `try_flush'
2023-06-30 06:21:18 +0000 [warn]: #0 /fluentd/vendor/bundle/ruby/3.1.0/gems/fluentd-1.16.1/lib/fluent/plugin/output.rb:1538:in `flush_thread_run'
2023-06-30 06:21:18 +0000 [warn]: #0 /fluentd/vendor/bundle/ruby/3.1.0/gems/fluentd-1.16.1/lib/fluent/plugin/output.rb:510:in `block (2 levels) in start'
2023-06-30 06:21:18 +0000 [warn]: #0 /fluentd/vendor/bundle/ruby/3.1.0/gems/fluentd-1.16.1/lib/fluent/plugin_helper/thread.rb:78:in `block in thread_create'
2023-06-30 06:21:18 +0000 [warn]: #0 [out_es] failed to flush the buffer. retry_times=1 next_retry_time=2023-06-30 06:21:20 +0000 chunk="5ff52d26a57f77ca2d6c08d45b842a36" error_class=Fluent::Plugin::ElasticsearchOutput::RecoverableRequestFailure error="could not push logs to Elasticsearch cluster ({:host=>\"elasticsearch.logging\", :port=>9200, :scheme=>\"http\", :path=>\"\"}): read timeout reached"
2023-06-30 06:21:18 +0000 [warn]: #0 /fluentd/vendor/bundle/ruby/3.1.0/gems/fluent-plugin-elasticsearch-5.2.5/lib/fluent/plugin/out_elasticsearch.rb:1146:in `rescue in send_bulk'
2023-06-30 06:21:18 +0000 [warn]: #0 /fluentd/vendor/bundle/ruby/3.1.0/gems/fluent-plugin-elasticsearch-5.2.5/lib/fluent/plugin/out_elasticsearch.rb:1108:in `send_bulk'
2023-06-30 06:21:18 +0000 [warn]: #0 /fluentd/vendor/bundle/ruby/3.1.0/gems/fluent-plugin-elasticsearch-5.2.5/lib/fluent/plugin/out_elasticsearch.rb:884:in `block in write'
2023-06-30 06:21:18 +0000 [warn]: #0 /fluentd/vendor/bundle/ruby/3.1.0/gems/fluent-plugin-elasticsearch-5.2.5/lib/fluent/plugin/out_elasticsearch.rb:883:in `each'
2023-06-30 06:21:18 +0000 [warn]: #0 /fluentd/vendor/bundle/ruby/3.1.0/gems/fluent-plugin-elasticsearch-5.2.5/lib/fluent/plugin/out_elasticsearch.rb:883:in `write'
2023-06-30 06:21:18 +0000 [warn]: #0 /fluentd/vendor/bundle/ruby/3.1.0/gems/fluentd-1.16.1/lib/fluent/plugin/output.rb:1225:in `try_flush'
2023-06-30 06:21:18 +0000 [warn]: #0 /fluentd/vendor/bundle/ruby/3.1.0/gems/fluentd-1.16.1/lib/fluent/plugin/output.rb:1538:in `flush_thread_run'
2023-06-30 06:21:18 +0000 [warn]: #0 /fluentd/vendor/bundle/ruby/3.1.0/gems/fluentd-1.16.1/lib/fluent/plugin/output.rb:510:in `block (2 levels) in start'
2023-06-30 06:21:18 +0000 [warn]: #0 /fluentd/vendor/bundle/ruby/3.1.0/gems/fluentd-1.16.1/lib/fluent/plugin_helper/thread.rb:78:in `block in thread_create'
2023-06-30 06:21:18 +0000 [warn]: #0 [out_es] failed to flush the buffer. retry_times=1 next_retry_time=2023-06-30 06:21:21 +0000 chunk="5ff52d268f5d044122847d1f7adbeb67" error_class=Fluent::Plugin::ElasticsearchOutput::RecoverableRequestFailure error="could not push logs to Elasticsearch cluster ({:host=>\"elasticsearch.logging\", :port=>9200, :scheme=>\"http\", :path=>\"\"}): read timeout reached"
2023-06-30 06:21:18 +0000 [warn]: #0 /fluentd/vendor/bundle/ruby/3.1.0/gems/fluent-plugin-elasticsearch-5.2.5/lib/fluent/plugin/out_elasticsearch.rb:1146:in `rescue in send_bulk'
2023-06-30 06:21:18 +0000 [warn]: #0 /fluentd/vendor/bundle/ruby/3.1.0/gems/fluent-plugin-elasticsearch-5.2.5/lib/fluent/plugin/out_elasticsearch.rb:1108:in `send_bulk'
2023-06-30 06:21:18 +0000 [warn]: #0 /fluentd/vendor/bundle/ruby/3.1.0/gems/fluent-plugin-elasticsearch-5.2.5/lib/fluent/plugin/out_elasticsearch.rb:884:in `block in write'
2023-06-30 06:21:18 +0000 [warn]: #0 /fluentd/vendor/bundle/ruby/3.1.0/gems/fluent-plugin-elasticsearch-5.2.5/lib/fluent/plugin/out_elasticsearch.rb:883:in `each'
2023-06-30 06:21:18 +0000 [warn]: #0 /fluentd/vendor/bundle/ruby/3.1.0/gems/fluent-plugin-elasticsearch-5.2.5/lib/fluent/plugin/out_elasticsearch.rb:883:in `write'
2023-06-30 06:21:18 +0000 [warn]: #0 /fluentd/vendor/bundle/ruby/3.1.0/gems/fluentd-1.16.1/lib/fluent/plugin/output.rb:1225:in `try_flush'
2023-06-30 06:21:18 +0000 [warn]: #0 /fluentd/vendor/bundle/ruby/3.1.0/gems/fluentd-1.16.1/lib/fluent/plugin/output.rb:1538:in `flush_thread_run'
2023-06-30 06:21:18 +0000 [warn]: #0 /fluentd/vendor/bundle/ruby/3.1.0/gems/fluentd-1.16.1/lib/fluent/plugin/output.rb:510:in `block (2 levels) in start'
2023-06-30 06:21:18 +0000 [warn]: #0 /fluentd/vendor/bundle/ruby/3.1.0/gems/fluentd-1.16.1/lib/fluent/plugin_helper/thread.rb:78:in `block in thread_create'
2023-06-30 06:21:20 +0000 [warn]: #0 [out_es] failed to flush the buffer. retry_times=1 next_retry_time=2023-06-30 06:21:23 +0000 chunk="5ff52d26cee4bdb5a31e3890d6e6e950" error_class=Fluent::Plugin::ElasticsearchOutput::RecoverableRequestFailure error="could not push logs to Elasticsearch cluster ({:host=>\"elasticsearch.logging\", :port=>9200, :scheme=>\"http\", :path=>\"\"}): read timeout reached"
2023-06-30 06:21:20 +0000 [warn]: #0 /fluentd/vendor/bundle/ruby/3.1.0/gems/fluent-plugin-elasticsearch-5.2.5/lib/fluent/plugin/out_elasticsearch.rb:1146:in `rescue in send_bulk'
2023-06-30 06:21:20 +0000 [warn]: #0 /fluentd/vendor/bundle/ruby/3.1.0/gems/fluent-plugin-elasticsearch-5.2.5/lib/fluent/plugin/out_elasticsearch.rb:1108:in `send_bulk'
2023-06-30 06:21:20 +0000 [warn]: #0 /fluentd/vendor/bundle/ruby/3.1.0/gems/fluent-plugin-elasticsearch-5.2.5/lib/fluent/plugin/out_elasticsearch.rb:884:in `block in write'
2023-06-30 06:21:20 +0000 [warn]: #0 /fluentd/vendor/bundle/ruby/3.1.0/gems/fluent-plugin-elasticsearch-5.2.5/lib/fluent/plugin/out_elasticsearch.rb:883:in `each'
2023-06-30 06:21:20 +0000 [warn]: #0 /fluentd/vendor/bundle/ruby/3.1.0/gems/fluent-plugin-elasticsearch-5.2.5/lib/fluent/plugin/out_elasticsearch.rb:883:in `write'
2023-06-30 06:21:20 +0000 [warn]: #0 /fluentd/vendor/bundle/ruby/3.1.0/gems/fluentd-1.16.1/lib/fluent/plugin/output.rb:1225:in `try_flush'
2023-06-30 06:21:20 +0000 [warn]: #0 /fluentd/vendor/bundle/ruby/3.1.0/gems/fluentd-1.16.1/lib/fluent/plugin/output.rb:1538:in `flush_thread_run'
2023-06-30 06:21:20 +0000 [warn]: #0 /fluentd/vendor/bundle/ruby/3.1.0/gems/fluentd-1.16.1/lib/fluent/plugin/output.rb:510:in `block (2 levels) in start'
2023-06-30 06:21:20 +0000 [warn]: #0 /fluentd/vendor/bundle/ruby/3.1.0/gems/fluentd-1.16.1/lib/fluent/plugin_helper/thread.rb:78:in `block in thread_create'
2023-06-30 06:21:22 +0000 [warn]: #0 [out_es] failed to flush the buffer. retry_times=1 next_retry_time=2023-06-30 06:21:24 +0000 chunk="5ff52d26817a5c28f7c0522302e4197e" error_class=Fluent::Plugin::ElasticsearchOutput::RecoverableRequestFailure error="could not push logs to Elasticsearch cluster ({:host=>\"elasticsearch.logging\", :port=>9200, :scheme=>\"http\", :path=>\"\"}): read timeout reached"
2023-06-30 06:21:22 +0000 [warn]: #0 /fluentd/vendor/bundle/ruby/3.1.0/gems/fluent-plugin-elasticsearch-5.2.5/lib/fluent/plugin/out_elasticsearch.rb:1146:in `rescue in send_bulk'
2023-06-30 06:21:22 +0000 [warn]: #0 /fluentd/vendor/bundle/ruby/3.1.0/gems/fluent-plugin-elasticsearch-5.2.5/lib/fluent/plugin/out_elasticsearch.rb:1108:in `send_bulk'
2023-06-30 06:21:22 +0000 [warn]: #0 /fluentd/vendor/bundle/ruby/3.1.0/gems/fluent-plugin-elasticsearch-5.2.5/lib/fluent/plugin/out_elasticsearch.rb:884:in `block in write'
2023-06-30 06:21:22 +0000 [warn]: #0 /fluentd/vendor/bundle/ruby/3.1.0/gems/fluent-plugin-elasticsearch-5.2.5/lib/fluent/plugin/out_elasticsearch.rb:883:in `each'
2023-06-30 06:21:22 +0000 [warn]: #0 /fluentd/vendor/bundle/ruby/3.1.0/gems/fluent-plugin-elasticsearch-5.2.5/lib/fluent/plugin/out_elasticsearch.rb:883:in `write'
2023-06-30 06:21:22 +0000 [warn]: #0 /fluentd/vendor/bundle/ruby/3.1.0/gems/fluentd-1.16.1/lib/fluent/plugin/output.rb:1225:in `try_flush'
2023-06-30 06:21:22 +0000 [warn]: #0 /fluentd/vendor/bundle/ruby/3.1.0/gems/fluentd-1.16.1/lib/fluent/plugin/output.rb:1538:in `flush_thread_run'
2023-06-30 06:21:22 +0000 [warn]: #0 /fluentd/vendor/bundle/ruby/3.1.0/gems/fluentd-1.16.1/lib/fluent/plugin/output.rb:510:in `block (2 levels) in start'
2023-06-30 06:21:22 +0000 [warn]: #0 /fluentd/vendor/bundle/ruby/3.1.0/gems/fluentd-1.16.1/lib/fluent/plugin_helper/thread.rb:78:in `block in thread_create'
2023-06-30 06:21:29 +0000 [warn]: #0 [out_es] failed to flush the buffer. retry_times=2 next_retry_time=2023-06-30 06:21:34 +0000 chunk="5ff52d269914e440895ef25a39279dc8" error_class=Fluent::Plugin::ElasticsearchOutput::RecoverableRequestFailure error="could not push logs to Elasticsearch cluster ({:host=>\"elasticsearch.logging\", :port=>9200, :scheme=>\"http\", :path=>\"\"}): read timeout reached"
2023-06-30 06:21:29 +0000 [warn]: #0 /fluentd/vendor/bundle/ruby/3.1.0/gems/fluent-plugin-elasticsearch-5.2.5/lib/fluent/plugin/out_elasticsearch.rb:1146:in `rescue in send_bulk'
2023-06-30 06:21:29 +0000 [warn]: #0 /fluentd/vendor/bundle/ruby/3.1.0/gems/fluent-plugin-elasticsearch-5.2.5/lib/fluent/plugin/out_elasticsearch.rb:1108:in `send_bulk'
2023-06-30 06:21:29 +0000 [warn]: #0 /fluentd/vendor/bundle/ruby/3.1.0/gems/fluent-plugin-elasticsearch-5.2.5/lib/fluent/plugin/out_elasticsearch.rb:884:in `block in write'
2023-06-30 06:21:29 +0000 [warn]: #0 /fluentd/vendor/bundle/ruby/3.1.0/gems/fluent-plugin-elasticsearch-5.2.5/lib/fluent/plugin/out_elasticsearch.rb:883:in `each'
2023-06-30 06:21:29 +0000 [warn]: #0 /fluentd/vendor/bundle/ruby/3.1.0/gems/fluent-plugin-elasticsearch-5.2.5/lib/fluent/plugin/out_elasticsearch.rb:883:in `write'
2023-06-30 06:21:29 +0000 [warn]: #0 /fluentd/vendor/bundle/ruby/3.1.0/gems/fluentd-1.16.1/lib/fluent/plugin/output.rb:1225:in `try_flush'
2023-06-30 06:21:29 +0000 [warn]: #0 /fluentd/vendor/bundle/ruby/3.1.0/gems/fluentd-1.16.1/lib/fluent/plugin/output.rb:1538:in `flush_thread_run'
2023-06-30 06:21:29 +0000 [warn]: #0 /fluentd/vendor/bundle/ruby/3.1.0/gems/fluentd-1.16.1/lib/fluent/plugin/output.rb:510:in `block (2 levels) in start'
2023-06-30 06:21:29 +0000 [warn]: #0 /fluentd/vendor/bundle/ruby/3.1.0/gems/fluentd-1.16.1/lib/fluent/plugin_helper/thread.rb:78:in `block in thread_create'
2023-06-30 06:21:29 +0000 [warn]: #0 [out_es] failed to flush the buffer. retry_times=2 next_retry_time=2023-06-30 06:21:34 +0000 chunk="5ff52d26817a5c28f7c0522302e4197e" error_class=Fluent::Plugin::ElasticsearchOutput::RecoverableRequestFailure error="could not push logs to Elasticsearch cluster ({:host=>\"elasticsearch.logging\", :port=>9200, :scheme=>\"http\", :path=>\"\"}): read timeout reached"
2023-06-30 06:21:29 +0000 [warn]: #0 /fluentd/vendor/bundle/ruby/3.1.0/gems/fluent-plugin-elasticsearch-5.2.5/lib/fluent/plugin/out_elasticsearch.rb:1146:in `rescue in send_bulk'
2023-06-30 06:21:29 +0000 [warn]: #0 /fluentd/vendor/bundle/ruby/3.1.0/gems/fluent-plugin-elasticsearch-5.2.5/lib/fluent/plugin/out_elasticsearch.rb:1108:in `send_bulk'
2023-06-30 06:21:29 +0000 [warn]: #0 /fluentd/vendor/bundle/ruby/3.1.0/gems/fluent-plugin-elasticsearch-5.2.5/lib/fluent/plugin/out_elasticsearch.rb:884:in `block in write'
2023-06-30 06:21:29 +0000 [warn]: #0 /fluentd/vendor/bundle/ruby/3.1.0/gems/fluent-plugin-elasticsearch-5.2.5/lib/fluent/plugin/out_elasticsearch.rb:883:in `each'
2023-06-30 06:21:29 +0000 [warn]: #0 /fluentd/vendor/bundle/ruby/3.1.0/gems/fluent-plugin-elasticsearch-5.2.5/lib/fluent/plugin/out_elasticsearch.rb:883:in `write'
2023-06-30 06:21:29 +0000 [warn]: #0 /fluentd/vendor/bundle/ruby/3.1.0/gems/fluentd-1.16.1/lib/fluent/plugin/output.rb:1225:in `try_flush'
2023-06-30 06:21:29 +0000 [warn]: #0 /fluentd/vendor/bundle/ruby/3.1.0/gems/fluentd-1.16.1/lib/fluent/plugin/output.rb:1538:in `flush_thread_run'
2023-06-30 06:21:29 +0000 [warn]: #0 /fluentd/vendor/bundle/ruby/3.1.0/gems/fluentd-1.16.1/lib/fluent/plugin/output.rb:510:in `block (2 levels) in start'
2023-06-30 06:21:29 +0000 [warn]: #0 /fluentd/vendor/bundle/ruby/3.1.0/gems/fluentd-1.16.1/lib/fluent/plugin_helper/thread.rb:78:in `block in thread_create'
2023-06-30 06:21:29 +0000 [warn]: #0 [out_es] failed to flush the buffer. retry_times=2 next_retry_time=2023-06-30 06:21:34 +0000 chunk="5ff52d26a57f77ca2d6c08d45b842a36" error_class=Fluent::Plugin::ElasticsearchOutput::RecoverableRequestFailure error="could not push logs to Elasticsearch cluster ({:host=>\"elasticsearch.logging\", :port=>9200, :scheme=>\"http\", :path=>\"\"}): read timeout reached"
2023-06-30 06:21:29 +0000 [warn]: #0 /fluentd/vendor/bundle/ruby/3.1.0/gems/fluent-plugin-elasticsearch-5.2.5/lib/fluent/plugin/out_elasticsearch.rb:1146:in `rescue in send_bulk'
2023-06-30 06:21:29 +0000 [warn]: #0 /fluentd/vendor/bundle/ruby/3.1.0/gems/fluent-plugin-elasticsearch-5.2.5/lib/fluent/plugin/out_elasticsearch.rb:1108:in `send_bulk'
2023-06-30 06:21:29 +0000 [warn]: #0 /fluentd/vendor/bundle/ruby/3.1.0/gems/fluent-plugin-elasticsearch-5.2.5/lib/fluent/plugin/out_elasticsearch.rb:884:in `block in write'
2023-06-30 06:21:29 +0000 [warn]: #0 /fluentd/vendor/bundle/ruby/3.1.0/gems/fluent-plugin-elasticsearch-5.2.5/lib/fluent/plugin/out_elasticsearch.rb:883:in `each'
2023-06-30 06:21:29 +0000 [warn]: #0 /fluentd/vendor/bundle/ruby/3.1.0/gems/fluent-plugin-elasticsearch-5.2.5/lib/fluent/plugin/out_elasticsearch.rb:883:in `write'
2023-06-30 06:21:29 +0000 [warn]: #0 /fluentd/vendor/bundle/ruby/3.1.0/gems/fluentd-1.16.1/lib/fluent/plugin/output.rb:1225:in `try_flush'
2023-06-30 06:21:29 +0000 [warn]: #0 /fluentd/vendor/bundle/ruby/3.1.0/gems/fluentd-1.16.1/lib/fluent/plugin/output.rb:1538:in `flush_thread_run'
2023-06-30 06:21:29 +0000 [warn]: #0 /fluentd/vendor/bundle/ruby/3.1.0/gems/fluentd-1.16.1/lib/fluent/plugin/output.rb:510:in `block (2 levels) in start'
2023-06-30 06:21:29 +0000 [warn]: #0 /fluentd/vendor/bundle/ruby/3.1.0/gems/fluentd-1.16.1/lib/fluent/plugin_helper/thread.rb:78:in `block in thread_create'
2023-06-30 06:21:29 +0000 [warn]: #0 [out_es] failed to flush the buffer. retry_times=2 next_retry_time=2023-06-30 06:21:34 +0000 chunk="5ff52d26b56ae37976da759e75e50233" error_class=Fluent::Plugin::ElasticsearchOutput::RecoverableRequestFailure error="could not push logs to Elasticsearch cluster ({:host=>\"elasticsearch.logging\", :port=>9200, :scheme=>\"http\", :path=>\"\"}): read timeout reached"
2023-06-30 06:21:29 +0000 [warn]: #0 /fluentd/vendor/bundle/ruby/3.1.0/gems/fluent-plugin-elasticsearch-5.2.5/lib/fluent/plugin/out_elasticsearch.rb:1146:in `rescue in send_bulk'
2023-06-30 06:21:29 +0000 [warn]: #0 /fluentd/vendor/bundle/ruby/3.1.0/gems/fluent-plugin-elasticsearch-5.2.5/lib/fluent/plugin/out_elasticsearch.rb:1108:in `send_bulk'
2023-06-30 06:21:29 +0000 [warn]: #0 /fluentd/vendor/bundle/ruby/3.1.0/gems/fluent-plugin-elasticsearch-5.2.5/lib/fluent/plugin/out_elasticsearch.rb:884:in `block in write'
2023-06-30 06:21:29 +0000 [warn]: #0 /fluentd/vendor/bundle/ruby/3.1.0/gems/fluent-plugin-elasticsearch-5.2.5/lib/fluent/plugin/out_elasticsearch.rb:883:in `each'
2023-06-30 06:21:29 +0000 [warn]: #0 /fluentd/vendor/bundle/ruby/3.1.0/gems/fluent-plugin-elasticsearch-5.2.5/lib/fluent/plugin/out_elasticsearch.rb:883:in `write'
2023-06-30 06:21:29 +0000 [warn]: #0 /fluentd/vendor/bundle/ruby/3.1.0/gems/fluentd-1.16.1/lib/fluent/plugin/output.rb:1225:in `try_flush'
2023-06-30 06:21:29 +0000 [warn]: #0 /fluentd/vendor/bundle/ruby/3.1.0/gems/fluentd-1.16.1/lib/fluent/plugin/output.rb:1538:in `flush_thread_run'
2023-06-30 06:21:29 +0000 [warn]: #0 /fluentd/vendor/bundle/ruby/3.1.0/gems/fluentd-1.16.1/lib/fluent/plugin/output.rb:510:in `block (2 levels) in start'
2023-06-30 06:21:29 +0000 [warn]: #0 /fluentd/vendor/bundle/ruby/3.1.0/gems/fluentd-1.16.1/lib/fluent/plugin_helper/thread.rb:78:in `block in thread_create'
2023-06-30 06:21:29 +0000 [warn]: #0 [out_es] failed to flush the buffer. retry_times=2 next_retry_time=2023-06-30 06:21:34 +0000 chunk="5ff52d26a0f7ab54a0c5aec00c38eab0" error_class=Fluent::Plugin::ElasticsearchOutput::RecoverableRequestFailure error="could not push logs to Elasticsearch cluster ({:host=>\"elasticsearch.logging\", :port=>9200, :scheme=>\"http\", :path=>\"\"}): read timeout reached"
....
|
使用Kibana查询日志
创建索引模式
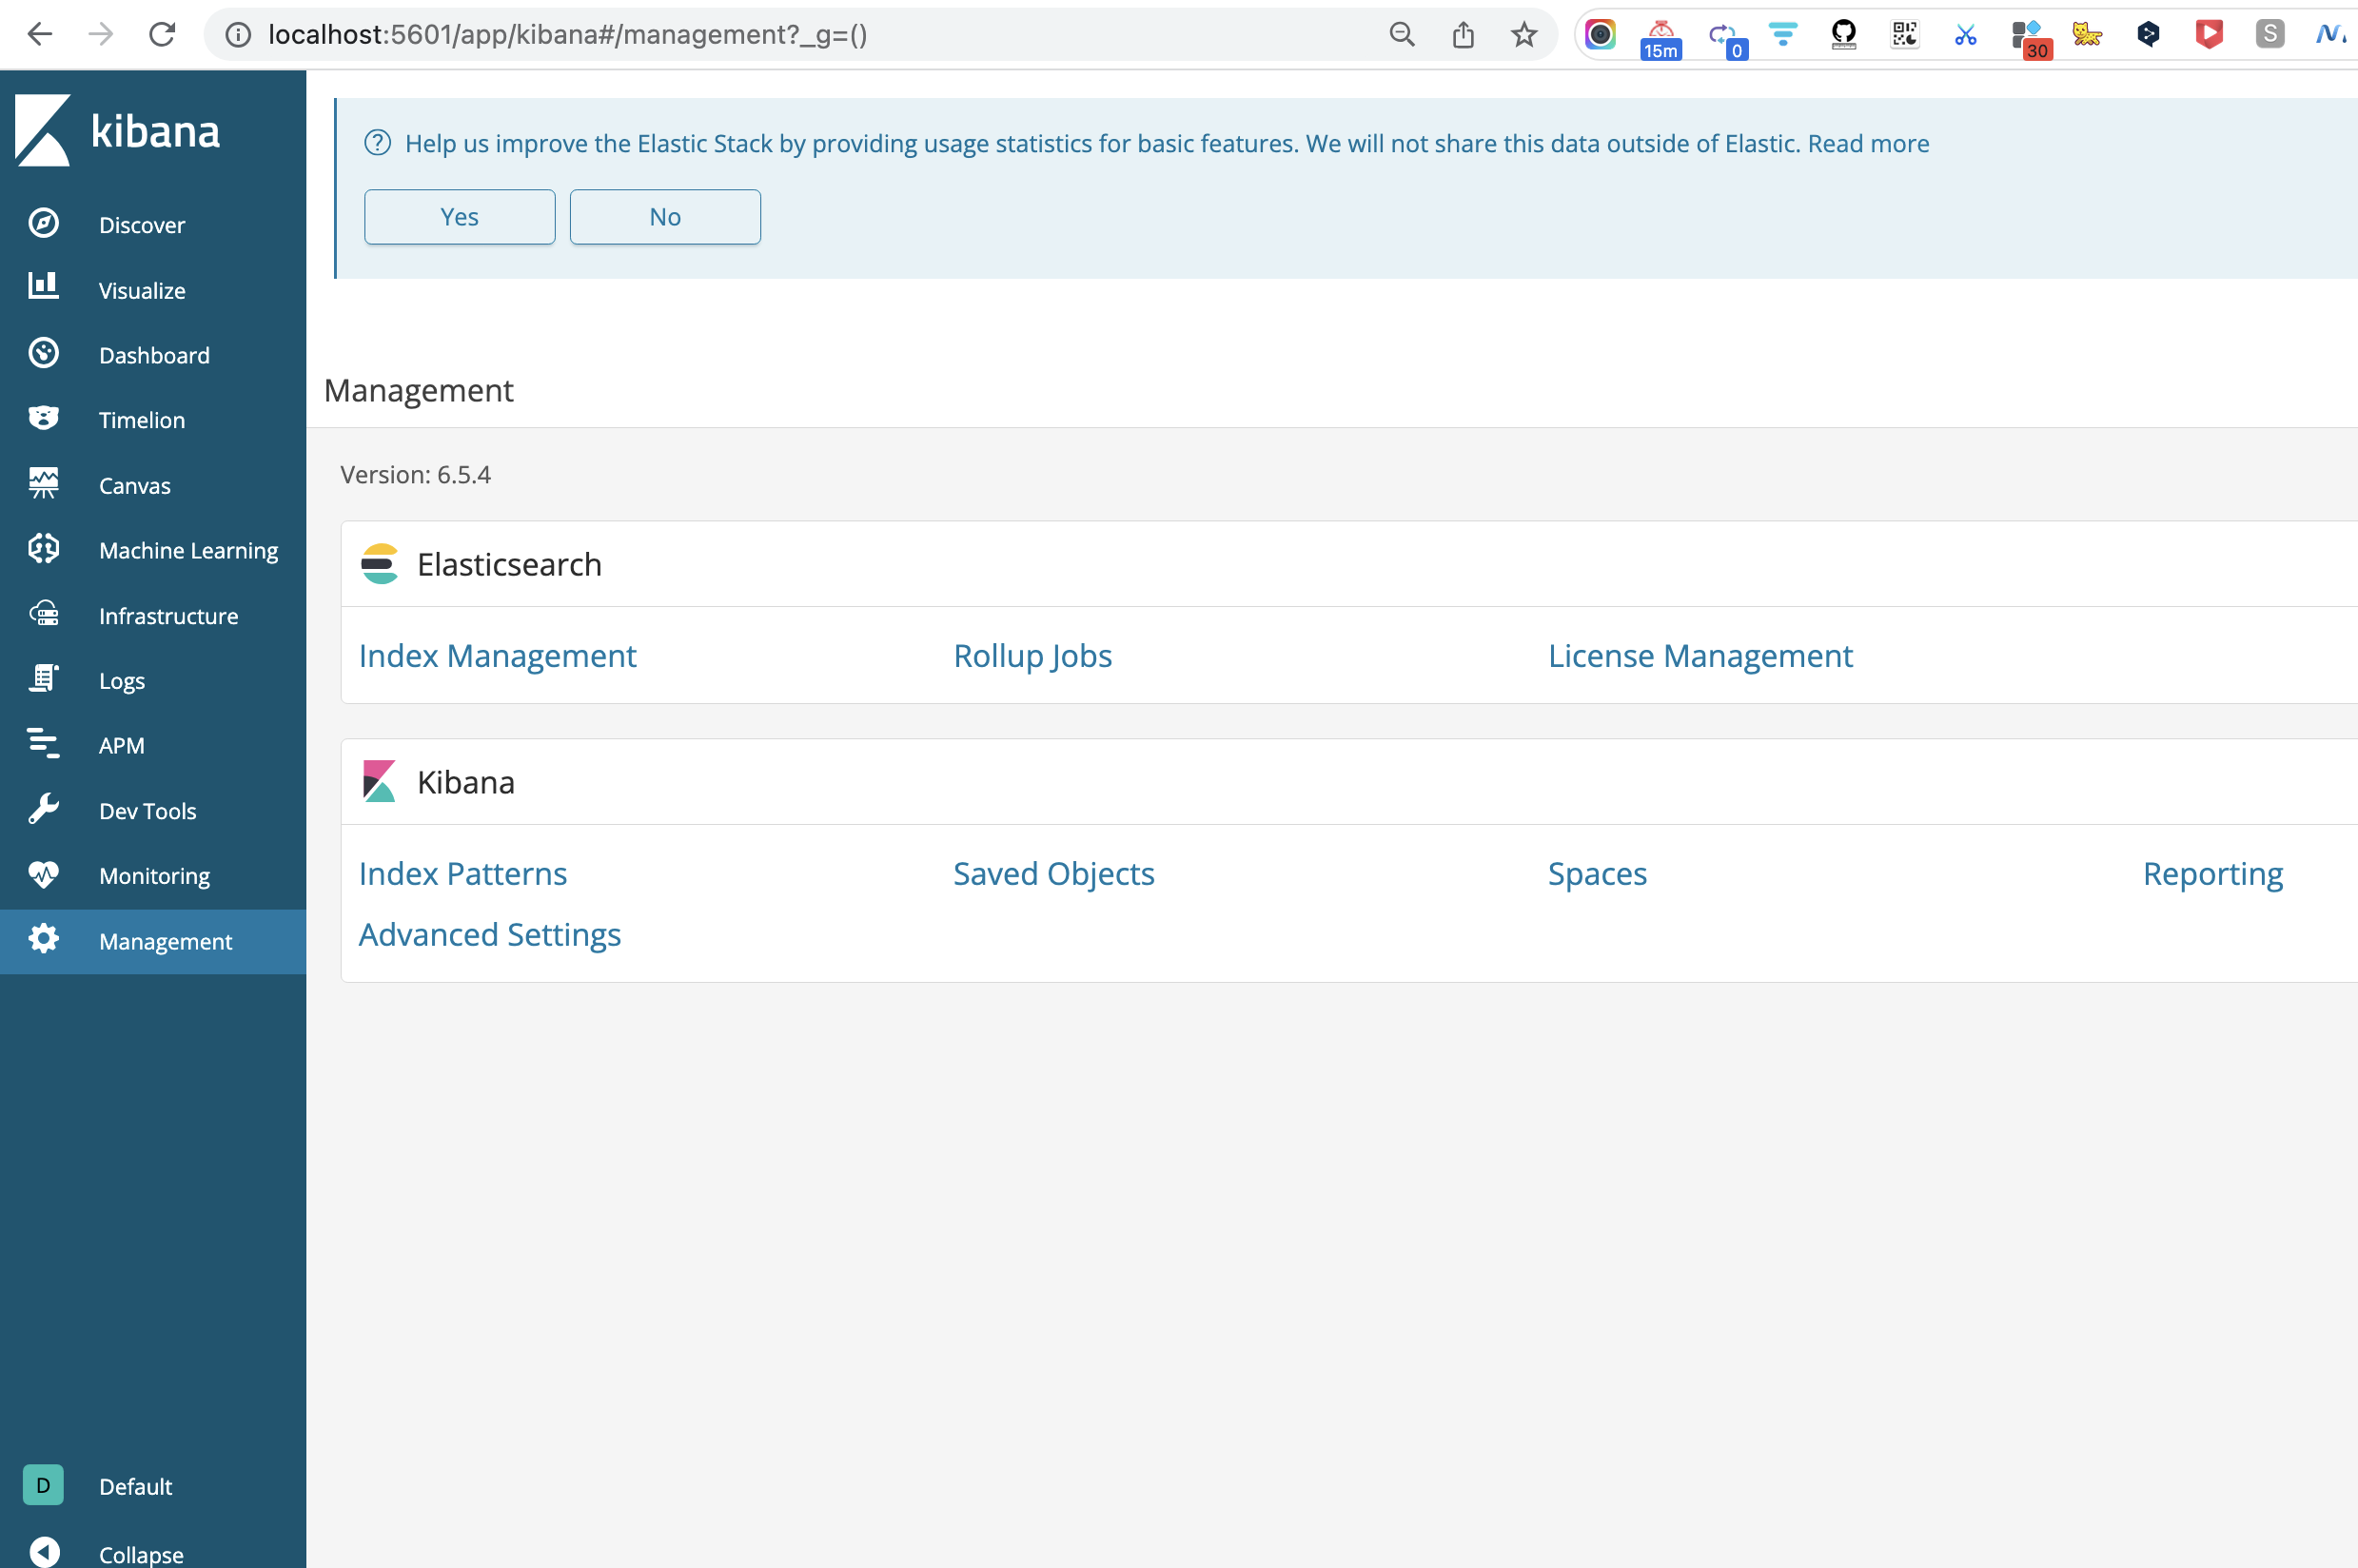
选择 Index Patterns
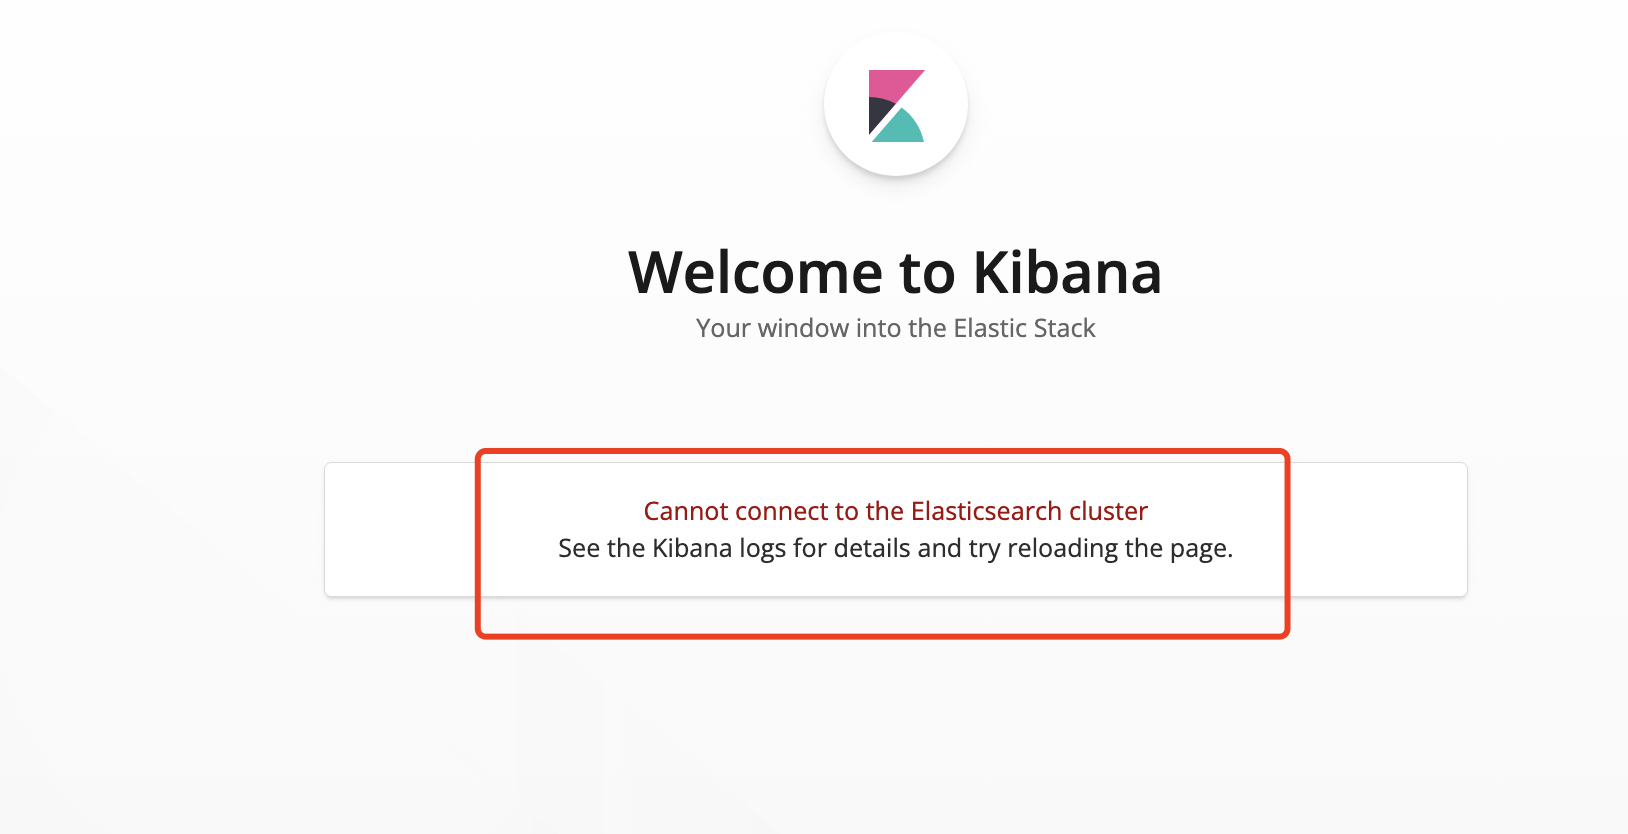
连接es集群有问题..
配置时间字段
发布PetClinic微服务本地版
过滤和选择字段
输入查询条件
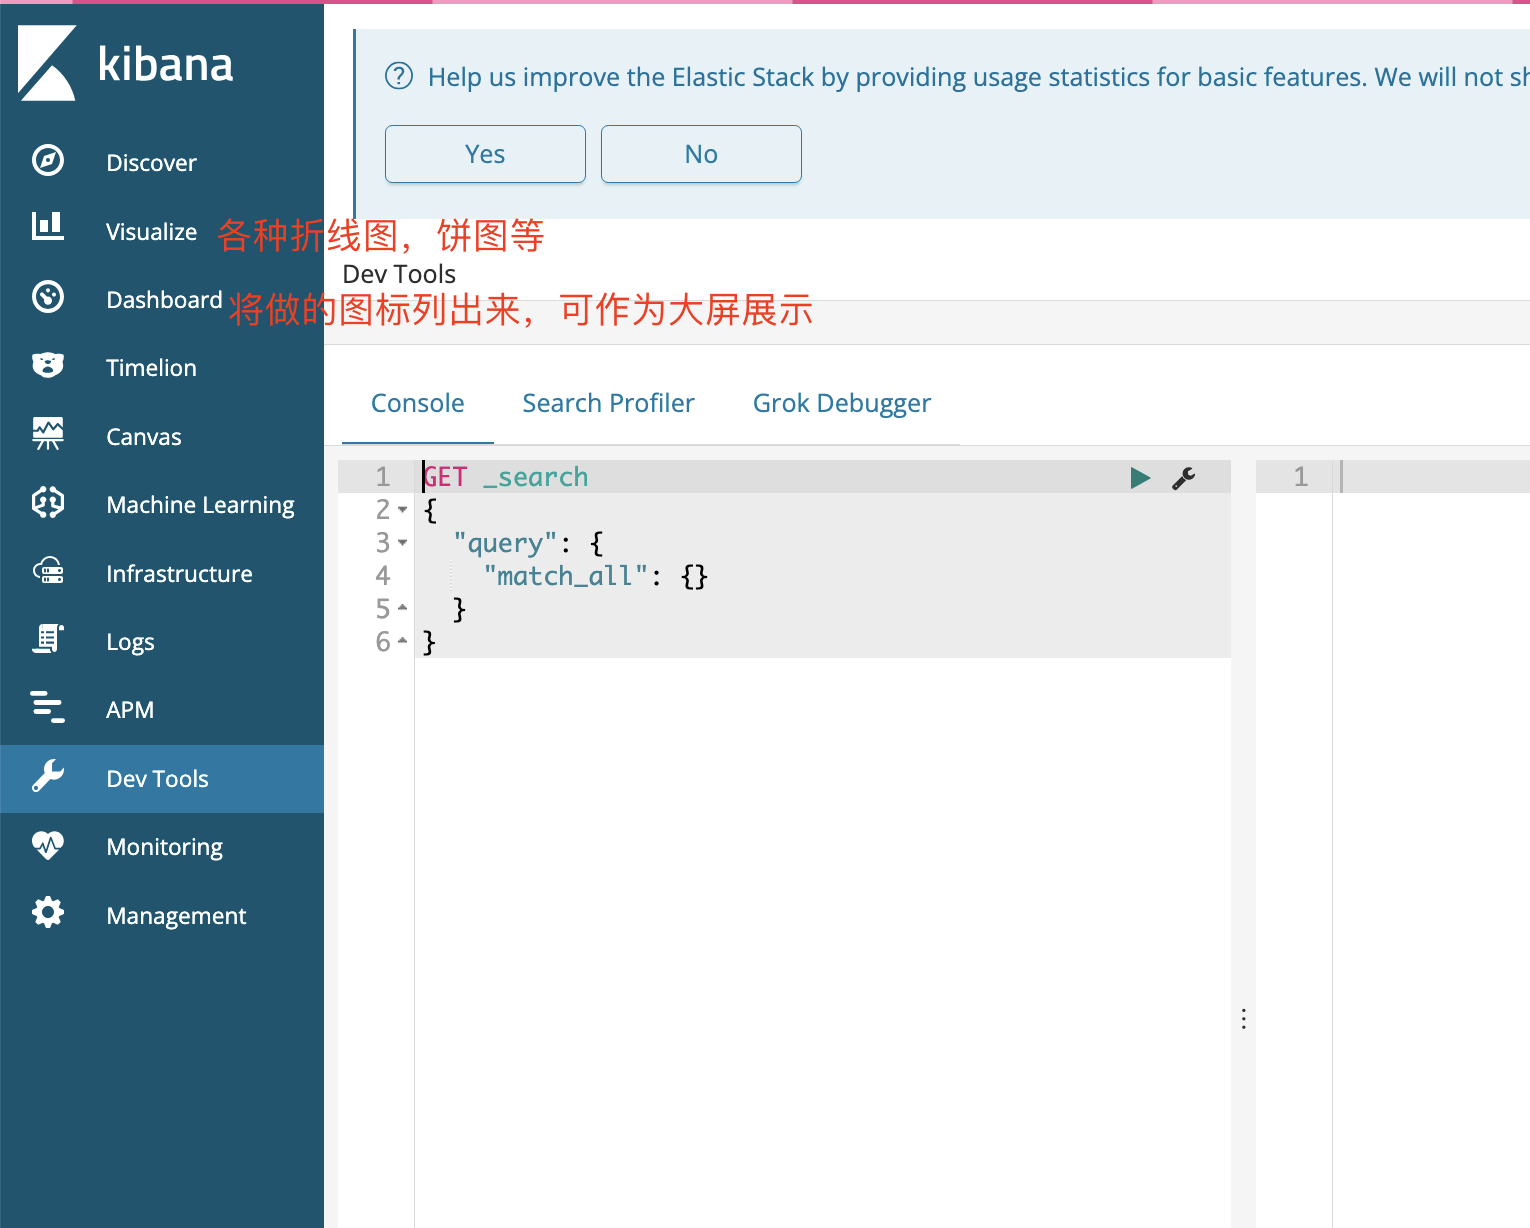
Kibana 是一个用于数据可视化和分析的开源工具,它提供了一系列的功能和选项。在 Kibana 页面的左侧导航栏上,通常会显示以下常见的标签页:
Discover(探索):用于探索和搜索数据的标签页。你可以在这里执行搜索、过滤和聚合操作,查看数据的详细信息,并创建可视化图表。
Visualize(可视化):用于创建和配置各种可视化图表的标签页。你可以选择不同的图表类型(如柱状图、饼图、地图等),选择数据源和字段,并定义图表的设置和样式。
Dashboard(仪表盘):用于创建和管理仪表盘的标签页。你可以将不同的可视化图表、搜索和过滤器组合到仪表盘中,以创建一个集中展示和监控数据的仪表盘视图。
Machine Learning(机器学习):用于在 Kibana 中进行机器学习任务的标签页。你可以在这里创建和管理基于数据的机器学习作业,进行异常检测、趋势预测等操作。
Dev Tools(开发者工具):提供了一个强大的开发者控制台,可以执行 Elasticsearch 查询和操作,以及调试和测试相关的 API 请求。
Management(管理):用于管理和配置 Kibana、Elasticsearch 和其他相关组件的标签页。你可以在这里管理索引模式、可视化对象、仪表盘、角色和用户等。
Stack Monitoring(堆栈监控):提供了对 Elasticsearch、Kibana 和整个堆栈的监控和可视化。你可以在这里查看集群的状态、性能指标和日志信息。
这些是 Kibana 页面常见的标签页。具体可用的标签页可能会根据 Kibana 版本、安装配置和权限设置的不同而有所变化。
原文链接: https://dashen.tech/2023/06/28/EFK日志监控平台搭建/
版权声明: 转载请注明出处.